HOT TOPICS LIST
- MACD
- Fibonacci
- RSI
- Gann
- ADXR
- Stochastics
- Volume
- Triangles
- Futures
- Cycles
- Volatility
- ZIGZAG
- MESA
- Retracement
- Aroon
INDICATORS LIST
LIST OF TOPICS
PRINT THIS ARTICLE
by David Penn
A classic reversal pattern helped traders anticipate the February 27th market meltdown in the NASDAQ 100.
Position: N/A
David Penn
Technical Writer for Technical Analysis of STOCKS & COMMODITIES magazine, Working-Money.com, and Traders.com Advantage.
PRINT THIS ARTICLE
REVERSAL
The QQQQ's 2B Top
03/02/07 09:44:16 AMby David Penn
A classic reversal pattern helped traders anticipate the February 27th market meltdown in the NASDAQ 100.
Position: N/A
| When I say a classic reversal pattern "helped traders anticipate," know that yours truly was not one of those traders so assisted. As I wrote mere days before the selloff on February 27, I was more interested in the possibility of the QQQQ actually breaking out than I was concerned that the NASDAQ 100 might melt down (see my Traders.com Advantage article, "Is The QQQQ Breakout At Hand?" from February 21). Specifically, I wrote that a weekly close above 44.86 after February 19 would be a bullish development for the QQQQ. That higher weekly close did come as the market ended on Friday, February 23, with a close of 45.26. And although the QQQQ has betrayed bullish traders with a false weekly breakout back in January, it appeared that the second time might be a charm. |

|
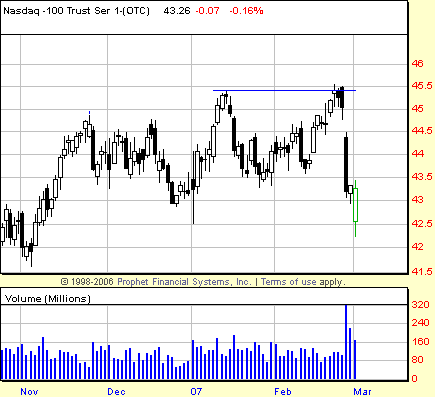
| FIGURE 1: NASDAQ 100 TRUST SERIES (QQQQ), DAILY. When the QQQQ failed to follow through to the upside after taking out the January highs, there was an increased possibility of a reversal by way of a 2B top. |
| Graphic provided by: Prophet Financial, Inc. |
| |
| So much for all that. While the February 27th reversal back to the downside, from a technical perspective, merely returns the QQQQ to the trading range it has inhabited since mid-November, that is a far cry from the breakout I had anticipated. The good news is that the market — at the daily level — was providing signs that, had I been more attentive, might have helped stem my enthusiasm for the upside that seemed to be indicated by the breakout in the weekly charts. |
| The flashing danger sign in the daily chart (Figure 1) was the 2B top that developed between the highs of January and the highs of February. I've written extensively about 2B tops, so I won't belabor the point here. Suffice to say that when a market makes a high, pulls back, makes a higher high, then fails to follow through to the upside, the possibility of a correction or reversal back to the downside is great. And that possibility is precisely what became reality on the penultimate day of February 2007. |

|
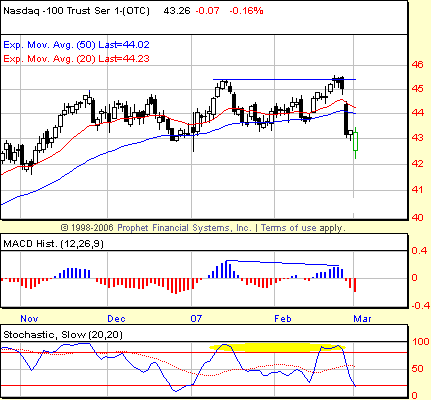
| FIGURE 2: NASDAQ 100 TRUST SERIES (QQQQ), DAILY. Negative divergences are often a 2B top's best friend. Such divergences in both the moving average convergence/divergence (MACD) histogram and the stochastic helped underscore the potential for a correction that was indicated by the 2B top. |
| Graphic provided by: Prophet Financial, Inc. |
| |
| One of the tricky things about some 2B tops is the exact entry. The rule of thumb is to enter when prices, retreating from the second higher high, move below the low of the initial high. In the case of the QQQQ, that would mean a short entry (or merely an exit if the trader was long at the time and did not want to short) at the low of January 16 at 45.13. Much of the time, the low of the second higher high is above the level of the low of the initial high. But many times that will not be the case, and the trader will have to figure out the best low under which to go short (or, again, to exit). While Victor Sperandeo, from whose work I learned the 2B concept, doesn't provide any specific rule, right now it seems like a good bet is to short or sell below the lower of the two lows. In those instances where the initial high has the lower low, then that low should be the target. And in those instances where the second, higher high has the lower low, then that low should be the target. |
| Looking at the QQQQ chart (Figure 2), the target for the short/sell would be the low of the second, higher high (February 22) at 45.07. Targeting this low would have gotten a trader short (or out of the position) on February 23. More cautious traders who prefer a close below the low would have had their trades executed on the following Monday, February 26, at 45.04. |
Technical Writer for Technical Analysis of STOCKS & COMMODITIES magazine, Working-Money.com, and Traders.com Advantage.
| Title: | Technical Writer |
| Company: | Technical Analysis, Inc. |
| Address: | 4757 California Avenue SW |
| Seattle, WA 98116 | |
| Phone # for sales: | 206 938 0570 |
| Fax: | 206 938 1307 |
| Website: | www.Traders.com |
| E-mail address: | DPenn@traders.com |
Traders' Resource Links | |
| Charting the Stock Market: The Wyckoff Method -- Books | |
| Working-Money.com -- Online Trading Services | |
| Traders.com Advantage -- Online Trading Services | |
| Technical Analysis of Stocks & Commodities -- Publications and Newsletters | |
| Working Money, at Working-Money.com -- Publications and Newsletters | |
| Traders.com Advantage -- Publications and Newsletters | |
| Professional Traders Starter Kit -- Software | |
Click here for more information about our publications!
Comments
Date: 03/02/07Rank: 2Comment:

Request Information From Our Sponsors
- StockCharts.com, Inc.
- Candle Patterns
- Candlestick Charting Explained
- Intermarket Technical Analysis
- John Murphy on Chart Analysis
- John Murphy's Chart Pattern Recognition
- John Murphy's Market Message
- MurphyExplainsMarketAnalysis-Intermarket Analysis
- MurphyExplainsMarketAnalysis-Visual Analysis
- StockCharts.com
- Technical Analysis of the Financial Markets
- The Visual Investor
- VectorVest, Inc.
- Executive Premier Workshop
- One-Day Options Course
- OptionsPro
- Retirement Income Workshop
- Sure-Fire Trading Systems (VectorVest, Inc.)
- Trading as a Business Workshop
- VectorVest 7 EOD
- VectorVest 7 RealTime/IntraDay
- VectorVest AutoTester
- VectorVest Educational Services
- VectorVest OnLine
- VectorVest Options Analyzer
- VectorVest ProGraphics v6.0
- VectorVest ProTrader 7
- VectorVest RealTime Derby Tool
- VectorVest Simulator
- VectorVest Variator
- VectorVest Watchdog
