HOT TOPICS LIST
- MACD
- Fibonacci
- RSI
- Gann
- ADXR
- Stochastics
- Volume
- Triangles
- Futures
- Cycles
- Volatility
- ZIGZAG
- MESA
- Retracement
- Aroon
INDICATORS LIST
LIST OF TOPICS
PRINT THIS ARTICLE
by David Penn
It's far from summertime, but May cotton futures appear to be establishing a bottom that could see higher cotton prices over the next several weeks.
Position: N/A
David Penn
Technical Writer for Technical Analysis of STOCKS & COMMODITIES magazine, Working-Money.com, and Traders.com Advantage.
PRINT THIS ARTICLE
REVERSAL
Cotton Rising?
03/01/07 11:20:21 AMby David Penn
It's far from summertime, but May cotton futures appear to be establishing a bottom that could see higher cotton prices over the next several weeks.
Position: N/A
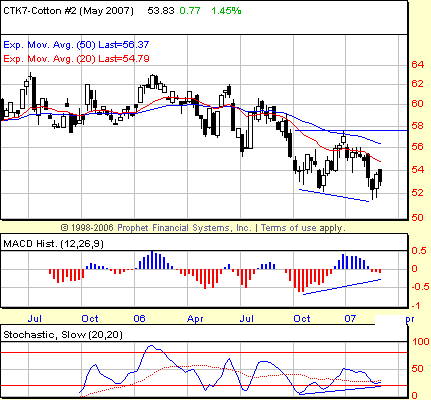
| Unfortunately, cotton futures did not make the cut for the latest edition of the Commodity Trader's Almanac 2007. Cotton was not alone in being excluded; orange juice, oats, and copper also make no appearance in this otherwise complete guide to commodity seasonality. In looking at the May cotton futures shown in Figure 1, I had hoped to find some seasonal backing to support the idea that a bottom in cotton was forming over the late autumn–early winter period. In the absence of that seasonal support (or, more accurately, the absence of any knowledge about seasonal support), this call for higher prices in cotton will have to stand on its own technical merits. |

|
| FIGURE 1: COTTON FUTURES, BASIS MAY, WEEKLY. Positive divergences in both the MACD histogram and the stochastic in this weekly chart of cotton futures suggests that spring will feature higher prices for this market. |
| Graphic provided by: Prophet Financial, Inc. |
| |
| For about two years, cotton futures have been trapped in a 10-cent (roughly $5,000 per contract) range between 48 and 58 cents (basis continuous futures). And there is little doubt that cotton traders and speculators have made a fine living out of buying cotton futures toward the bottom of this range and selling them toward the top. The fact that as May cotton futures have slipped to the 52-cent level at the same time that positive divergences have begun to appear does not suggest that any subsequent rally in cotton futures won't simply be part of this range-bound pattern. |
| Fortunately, it is not likely to matter. Range-bound or range-breaking, speculators who go long on cotton can take from the positive divergences in the moving average convergence/divergence (MACD) histogram and stochastic what they will. At a minimum, these divergences (shown in Figure 1) suggest significant support at the 52 level — the lower low in price that is matched by the higher low in both the MACD histogram and the stochastic. And should the 52 level prove to be at least a temporary floor, then there is a chance that May cotton will be able to rally and test the late December high near 57.50. In fact, a move to the 57–58 level would create a potential double bottom in May cotton — with one trough low in late November and the other in mid-February — that could mean a more significant move higher. |

|
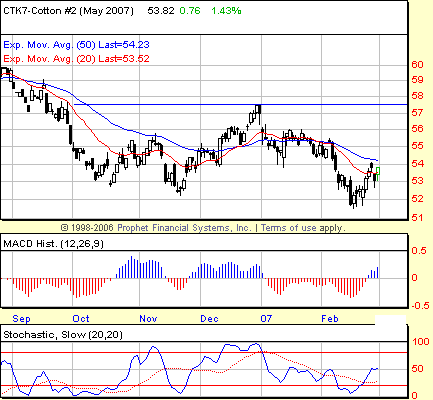
| FIGURE 2: COTTON FUTURES, BASIS MAY, DAILY. The absence of a positive divergence in the MACD histogram or stochastic in this daily chart of May cotton suggests that a move higher might still be a little way off. Significant resistance appears to be in place at the 55 level and the depth of the MACD histogram trough in mid-February suggests that a test of the February lows could come before a rally above the February highs. |
| Graphic provided by: Prophet Financial, Inc. |
| |
| Figure 2, a daily chart, is not as promising as the weekly chart for those looking for a move to the upside. The divergences that point to higher prices in the weekly chart are not present in the daily. Instead, both the MACD histogram and the stochastic are making lower lows in tandem with price action in mid-February. In addition, the resistance that May cotton will have to overcome in order to reach the high between the two troughs mentioned previously is clearly visible in the daily chart in the form of the January consolidation, which reaches as low as 54. Indeed, it already appears as if May cotton has made one run at higher prices and failed at precisely that 54 level. |
| Potential resistance in the form of the downward-sloping 50-day exponential moving average (EMA) also adds a note of caution to any thoughts of an easy ride higher in May cotton. As such, the path of least resistance higher might include either some time spent consolidating at current levels or, failing that, a move lower to test the February lows. |
Technical Writer for Technical Analysis of STOCKS & COMMODITIES magazine, Working-Money.com, and Traders.com Advantage.
| Title: | Technical Writer |
| Company: | Technical Analysis, Inc. |
| Address: | 4757 California Avenue SW |
| Seattle, WA 98116 | |
| Phone # for sales: | 206 938 0570 |
| Fax: | 206 938 1307 |
| Website: | www.Traders.com |
| E-mail address: | DPenn@traders.com |
Traders' Resource Links | |
| Charting the Stock Market: The Wyckoff Method -- Books | |
| Working-Money.com -- Online Trading Services | |
| Traders.com Advantage -- Online Trading Services | |
| Technical Analysis of Stocks & Commodities -- Publications and Newsletters | |
| Working Money, at Working-Money.com -- Publications and Newsletters | |
| Traders.com Advantage -- Publications and Newsletters | |
| Professional Traders Starter Kit -- Software | |
Click here for more information about our publications!
Comments
Date: 03/01/07Rank: 2Comment:

|

Request Information From Our Sponsors
- StockCharts.com, Inc.
- Candle Patterns
- Candlestick Charting Explained
- Intermarket Technical Analysis
- John Murphy on Chart Analysis
- John Murphy's Chart Pattern Recognition
- John Murphy's Market Message
- MurphyExplainsMarketAnalysis-Intermarket Analysis
- MurphyExplainsMarketAnalysis-Visual Analysis
- StockCharts.com
- Technical Analysis of the Financial Markets
- The Visual Investor
- VectorVest, Inc.
- Executive Premier Workshop
- One-Day Options Course
- OptionsPro
- Retirement Income Workshop
- Sure-Fire Trading Systems (VectorVest, Inc.)
- Trading as a Business Workshop
- VectorVest 7 EOD
- VectorVest 7 RealTime/IntraDay
- VectorVest AutoTester
- VectorVest Educational Services
- VectorVest OnLine
- VectorVest Options Analyzer
- VectorVest ProGraphics v6.0
- VectorVest ProTrader 7
- VectorVest RealTime Derby Tool
- VectorVest Simulator
- VectorVest Variator
- VectorVest Watchdog
