HOT TOPICS LIST
- MACD
- Fibonacci
- RSI
- Gann
- ADXR
- Stochastics
- Volume
- Triangles
- Futures
- Cycles
- Volatility
- ZIGZAG
- MESA
- Retracement
- Aroon
INDICATORS LIST
LIST OF TOPICS
PRINT THIS ARTICLE
by Gary Grosschadl
Yesterday's Shanghai Composite Index meltdown caused major short-term dives on many major indexes around the world.
Position: Sell
Gary Grosschadl
Independent Canadian equities trader and technical analyst based in Peterborough
Ontario, Canada.
PRINT THIS ARTICLE
CANDLESTICK CHARTING
Tokyo Nikkei Warning
03/01/07 09:25:30 AMby Gary Grosschadl
Yesterday's Shanghai Composite Index meltdown caused major short-term dives on many major indexes around the world.
Position: Sell
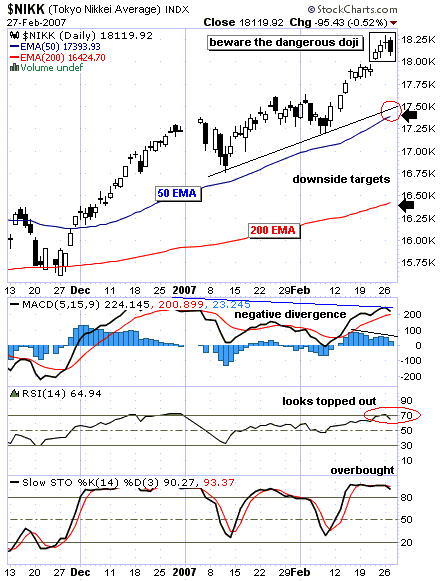
| Market pundits say the Shanghai Composite Index fall, and the resultant drop on the part of many major indexes, was an overreaction and praised the Tokyo Nikkei index ($NIKK) for not taking a similar hit, while the Dow Jones industrials, for example, suffered its biggest one-day drop since 9/11. Taking a closer look at the "saved" Tokyo index, however, I draw little comfort. See Figure 1. |
| A doji top (with its telltale small cross) often marks major reversal points after large uplegs or downlegs. I never take these lightly, as they tend to be one of the more reliable candlestick patterns. After a doji top or bottom, the next day's candlestick is taken to be confirmation. A close below yesterday's low confirms the bearish warning, while a move above the doji negates it. For the sake of some prudence, let's wait for additional nearby confirmation. A close below 18,000 would be stronger confirmation. |

|
| FIGURE 1: NIKKEI, DAILY. Could this be a classic candlestick top? |
| Graphic provided by: StockCharts.com. |
| |
| Two major support levels are possible should a sizable downturn develop. The 50-day exponential moving average (EMA) closely mirrors trendline support and currently resides at 17,394. Much stronger support would be at the 200-day EMA at 16,424. Note how the 200-day EMA held support in December 2006. |
| Several indicators can be considered. The moving average convergence/divergence (MACD) and the relative strength index (RSI) both show their own warnings via a negative divergence to price action. As the index rose to the recent peak, these indicators refused to do likewise, offering a caution or warning of a possible coming downturn. The stochastic oscillator is in overbought territory, above the 80 level. A dip below 80 usually confirms a downleg developing, so this could act as another bearish confirmation. |
| Dangerous doji or a head fake? Stay tuned to this index as a harbinger of the market puzzle that traders so often try to piece together. |
Independent Canadian equities trader and technical analyst based in Peterborough
Ontario, Canada.
| Website: | www.whatsonsale.ca/financial.html |
| E-mail address: | gwg7@sympatico.ca |
Click here for more information about our publications!
Comments
Date: 03/01/07Rank: 5Comment:

Request Information From Our Sponsors
- StockCharts.com, Inc.
- Candle Patterns
- Candlestick Charting Explained
- Intermarket Technical Analysis
- John Murphy on Chart Analysis
- John Murphy's Chart Pattern Recognition
- John Murphy's Market Message
- MurphyExplainsMarketAnalysis-Intermarket Analysis
- MurphyExplainsMarketAnalysis-Visual Analysis
- StockCharts.com
- Technical Analysis of the Financial Markets
- The Visual Investor
- VectorVest, Inc.
- Executive Premier Workshop
- One-Day Options Course
- OptionsPro
- Retirement Income Workshop
- Sure-Fire Trading Systems (VectorVest, Inc.)
- Trading as a Business Workshop
- VectorVest 7 EOD
- VectorVest 7 RealTime/IntraDay
- VectorVest AutoTester
- VectorVest Educational Services
- VectorVest OnLine
- VectorVest Options Analyzer
- VectorVest ProGraphics v6.0
- VectorVest ProTrader 7
- VectorVest RealTime Derby Tool
- VectorVest Simulator
- VectorVest Variator
- VectorVest Watchdog
