HOT TOPICS LIST
- MACD
- Fibonacci
- RSI
- Gann
- ADXR
- Stochastics
- Volume
- Triangles
- Futures
- Cycles
- Volatility
- ZIGZAG
- MESA
- Retracement
- Aroon
INDICATORS LIST
LIST OF TOPICS
PRINT THIS ARTICLE
by David Penn
A 50-plus point decline in the S&P 500 leaves traders looking for clues on when to climb back in.
Position: N/A
David Penn
Technical Writer for Technical Analysis of STOCKS & COMMODITIES magazine, Working-Money.com, and Traders.com Advantage.
PRINT THIS ARTICLE
FIBONACCI
Betting On The Bounce
03/01/07 10:00:39 AMby David Penn
A 50-plus point decline in the S&P 500 leaves traders looking for clues on when to climb back in.
Position: N/A
A little over a month ago, in an article that is now on Working-Money.com ("Fifth Of A Fifth?"), I posted an Elliott wave projection that suggested the possibility of a top at the 1462 level. Specifically, I concluded:"But a keen eye on longer-term negative divergences in indicators like the MACD histogram — as well as on price action as the S&P 500 approaches the potential top target of 1,462 — would probably be a smart hobby while pursuing the main work of trading and speculating on a market that, until proven otherwise, continues to move higher." |

|
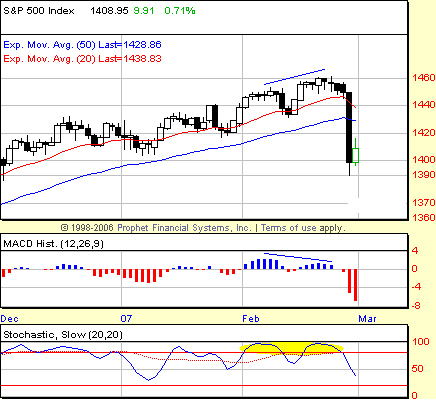
| FIGURE 1: STANDARD & POOR'S 500, DAILY. Negative divergences in both the MACD histogram and the stochastic should have alerted observant traders that upside progress would be hard to come by in the end of February and beginning of March time frame. |
| Graphic provided by: Prophet Financial, Inc. |
| |
| Again, that was written back in late January. For what it's worth, I was certainly bullish going into the market's smackdown on the penultimate day of February and remain, however improbably, bullish still. As Jim Cramer reminds us, nobody ever made a dime by panicking. And given the magnitude of the move lower, it is imperative that those who were bullish in the intermediate term going into the correction recalibrate their bullishness as the market searches for a way out. |
| First, was there anything that speculators could have spotted that would have alerted them to the potential for trouble in late February–early March? Truth told, there were — though I of course didn't spot them until after the fact. Both the MACD histogram and the stochastic had developed negative divergences with the Standard & Poor's 500's most recent push toward 1460 in the second half of February (Figure 1). And while there was nothing in those negative divergences to inform traders of the carnage that would soon take place, it can't be disputed that the divergences were telling the important story once again — whether or not anyone was listening. |

|
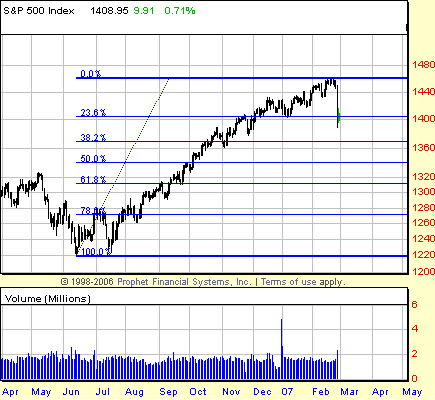
| FIGURE 2: STANDARD & POOR'S 500, DAILY. The first move down in the S&P 500's late winter–early spring correction took the market below the 23.6% retracement level. Next Fibonacci support lies at the 38.2% retracement level near 1360, and the location of a previous correction low. |
| Graphic provided by: Prophet Financial, Inc. |
| |
| What now? The talking heads of CNBC, which dedicated large chunks of programming the night of the mini-meltdown to reassuring anxious viewers and investors, generally suggested that (a) the move down was just a correction in a bull market and (b) now was not the time to buy in. I actually suspect the talking heads are right on both counts. Although the move down on February 27 took out a few, previous minor correction lows, it thus far has retraced so little of the advance from the summer of 2006 bottom that it must be treated as a correction within a bull market rather than as a incontrovertible reversal of trend. At least at this point. As Figure 2 shows, the correction has yet to breach the Fibonacci retracement level of 38.2% — often considered the most modest of the Fibonacci retracements. |
| The support found at the end of the S&P 500's initial plunge lower came from the correction lows of late December 2006 and early January 2007 as well as perhaps the "round number support" at 1400. While there will no doubt be buyers stepping in at these levels — and a good chance that those buyers might reap decent trading gains from, say, a one- to three-session bounce — it would not be surprising in the slightest if the market resumed its correction, particularly with the goal of testing the 38.2% retracement level just discussed (Figure 2). This retracement level lies at approximately 1370, more or less halfway between two correction lows in early and late November 2006. |
Technical Writer for Technical Analysis of STOCKS & COMMODITIES magazine, Working-Money.com, and Traders.com Advantage.
| Title: | Technical Writer |
| Company: | Technical Analysis, Inc. |
| Address: | 4757 California Avenue SW |
| Seattle, WA 98116 | |
| Phone # for sales: | 206 938 0570 |
| Fax: | 206 938 1307 |
| Website: | www.Traders.com |
| E-mail address: | DPenn@traders.com |
Traders' Resource Links | |
| Charting the Stock Market: The Wyckoff Method -- Books | |
| Working-Money.com -- Online Trading Services | |
| Traders.com Advantage -- Online Trading Services | |
| Technical Analysis of Stocks & Commodities -- Publications and Newsletters | |
| Working Money, at Working-Money.com -- Publications and Newsletters | |
| Traders.com Advantage -- Publications and Newsletters | |
| Professional Traders Starter Kit -- Software | |
Click here for more information about our publications!
Comments
Date: 03/01/07Rank: 3Comment:
Date: 03/06/07Rank: 5Comment:

Request Information From Our Sponsors
- StockCharts.com, Inc.
- Candle Patterns
- Candlestick Charting Explained
- Intermarket Technical Analysis
- John Murphy on Chart Analysis
- John Murphy's Chart Pattern Recognition
- John Murphy's Market Message
- MurphyExplainsMarketAnalysis-Intermarket Analysis
- MurphyExplainsMarketAnalysis-Visual Analysis
- StockCharts.com
- Technical Analysis of the Financial Markets
- The Visual Investor
- VectorVest, Inc.
- Executive Premier Workshop
- One-Day Options Course
- OptionsPro
- Retirement Income Workshop
- Sure-Fire Trading Systems (VectorVest, Inc.)
- Trading as a Business Workshop
- VectorVest 7 EOD
- VectorVest 7 RealTime/IntraDay
- VectorVest AutoTester
- VectorVest Educational Services
- VectorVest OnLine
- VectorVest Options Analyzer
- VectorVest ProGraphics v6.0
- VectorVest ProTrader 7
- VectorVest RealTime Derby Tool
- VectorVest Simulator
- VectorVest Variator
- VectorVest Watchdog
