HOT TOPICS LIST
- MACD
- Fibonacci
- RSI
- Gann
- ADXR
- Stochastics
- Volume
- Triangles
- Futures
- Cycles
- Volatility
- ZIGZAG
- MESA
- Retracement
- Aroon
INDICATORS LIST
LIST OF TOPICS
PRINT THIS ARTICLE
by Gary Grosschadl
The violation of a significant moving average line often is a tipoff to a trend change or start of a correction.
Position: Sell
Gary Grosschadl
Independent Canadian equities trader and technical analyst based in Peterborough
Ontario, Canada.
PRINT THIS ARTICLE
MOVING AVERAGES
Microsoft In Failure Mode
02/28/07 09:43:19 AMby Gary Grosschadl
The violation of a significant moving average line often is a tipoff to a trend change or start of a correction.
Position: Sell
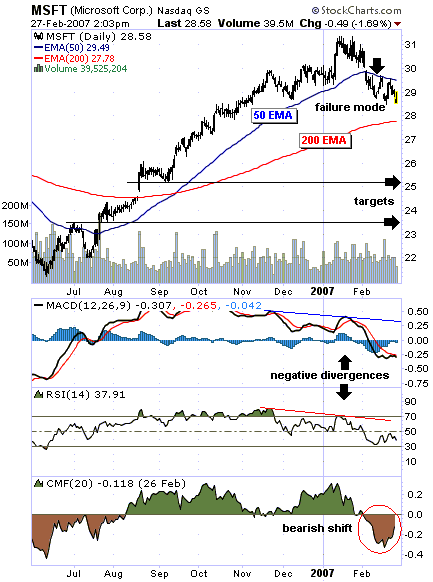
| Figure 1 shows Microsoft (MSFT) enjoyed a large upleg starting the summer of 2006, rising near 50%. Note how well the 50-day exponential moving average (EMA) carved out support. Now this support line is broken and is showing signs of switching polarity. What was support is now resistance. I call this a "failure mode," as I consider this 50-day EMA to be key resistance and rallies up to this line to be bear rallies. As long as this overhead resistance holds, I remain bearish on the stock. |
| Note the 200-day EMA, currently at 27.88. This could save the stock or cause a consolidation before possibly falling further. Either way, the 50-day EMA is now resistance. A bounce off the 200-day EMA may end up as another bear rally, keeping the stock in failure mode. |

|
| FIGURE 1: MSFT, DAILY. Has Microsoft topped out? |
| Graphic provided by: StockCharts.com. |
| |
| Several indicators are worthy of note. The moving average convergence/divergence (MACD) and the relative strength index (RSI) both show major divergences to price action. As the stock was hitting a peak, these indicators failed to follow suit, hinting at a coming decline. Meanwhile, the Chaikin money flow indicator made a big shift to bearish power. When buying power dries up, bears often seize control. |
| Two targets are near $25 and 23.50. They represent previous levels of support that could be bounce targets. Failure there would bring a likely test of the low near $21. |
| Until MSFT can rise above its 50-day EMA and once again turn this moving average into support, the bears will rule the day. |
Independent Canadian equities trader and technical analyst based in Peterborough
Ontario, Canada.
| Website: | www.whatsonsale.ca/financial.html |
| E-mail address: | gwg7@sympatico.ca |
Click here for more information about our publications!
Comments
Date: 03/01/07Rank: 5Comment:

Request Information From Our Sponsors
- StockCharts.com, Inc.
- Candle Patterns
- Candlestick Charting Explained
- Intermarket Technical Analysis
- John Murphy on Chart Analysis
- John Murphy's Chart Pattern Recognition
- John Murphy's Market Message
- MurphyExplainsMarketAnalysis-Intermarket Analysis
- MurphyExplainsMarketAnalysis-Visual Analysis
- StockCharts.com
- Technical Analysis of the Financial Markets
- The Visual Investor
- VectorVest, Inc.
- Executive Premier Workshop
- One-Day Options Course
- OptionsPro
- Retirement Income Workshop
- Sure-Fire Trading Systems (VectorVest, Inc.)
- Trading as a Business Workshop
- VectorVest 7 EOD
- VectorVest 7 RealTime/IntraDay
- VectorVest AutoTester
- VectorVest Educational Services
- VectorVest OnLine
- VectorVest Options Analyzer
- VectorVest ProGraphics v6.0
- VectorVest ProTrader 7
- VectorVest RealTime Derby Tool
- VectorVest Simulator
- VectorVest Variator
- VectorVest Watchdog
