

HOT TOPICS LIST
- MACD
- Fibonacci
- RSI
- Gann
- ADXR
- Stochastics
- Volume
- Triangles
- Futures
- Cycles
- Volatility
- ZIGZAG
- MESA
- Retracement
- Aroon
INDICATORS LIST
LIST OF TOPICS
PRINT THIS ARTICLE
by Chaitali Mohile
A fresh upward move can be expected in Qualcomm.
Position: Buy
Chaitali Mohile
Active trader in the Indian stock markets since 2003 and a full-time writer. Trading is largely based upon technical analysis.
PRINT THIS ARTICLE
TECHNICAL ANALYSIS
Moving Average Crossover = Fresh Rally In QCOM
02/28/07 09:29:17 AMby Chaitali Mohile
A fresh upward move can be expected in Qualcomm.
Position: Buy
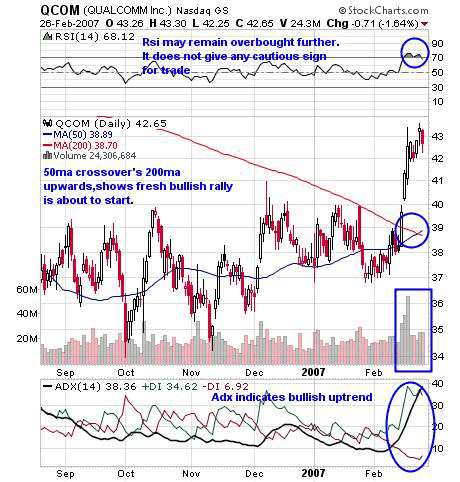
| Moving averages show the direction of the rally. Though it does not indicate the direction of the trend, price movement can be determined. In QualComm (QCOMM), as seen in Figure 1, the 50-day moving average (MA) has crossed the 200-day MA upward. This crossover indicates that a fresh rally is about to start. The stock had been moving in a downward consolidation for a long time. A sudden surge in price increased the volume on the stock. The 50-day MA crossover will add strength to the rally. |
| The average directional movement index (ADX)(14) is at 38, indicating the developed healthy bullish strength and the trend stability. The relative strength index (RSI)(14) suddenly crossed 50 as the price moved. At current levels, the RSI is slightly overbought but not alarming, as it can remain overbought longer. Traders can thus go long on this stock. This moving average crossover ensures the fresh healthy rally ahead. |
|
| FIGURE 1: QCOM, DAILY. Moving averages are good indicators of a rally. |
| Graphic provided by: StockCharts.com. |
| |
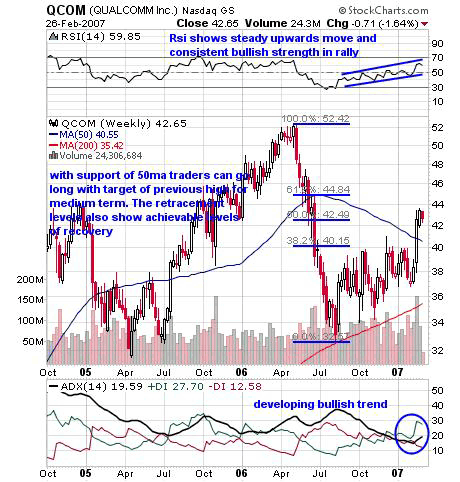
| As Figure 2 shows, QCOM has slid to $32.50 from $52.47. After this short-term correction, the stock consolidated at a lower level at a 38.20% retracement. This retracement gives the idea of a resistance level in the upcoming rally. These levels can also be seen as the next targets if the pullback is healthier. On the same grounds, after the 38.20% retracement level was crossed, the next resistance was also tested — the 50% level. |
| The ADX (14) above 15 shows the trend is developing and more buying pressure is coming. The RSI (14) is moving up. But as 50% level was tested, the RSI suddenly moved above 50, indicating the bullish strength in the rally. This scenario offers a buying opportunity at the current level. Traders can watch for the various retracement levels as their target for the upward rally. The current price level is also above 50-day MA. So along with 38.20% retracement level, the 50-day MA should also be watched as support for the rally. Thus, the pullback rally on QCOM can be bought. The moving average crossover highlights such a pullback. |
|
| FIGURE 2: QCOM, WEEKLY. The retracement shows the various levels for a pullback rally. |
| Graphic provided by: StockCharts.com. |
| |
Active trader in the Indian stock markets since 2003 and a full-time writer. Trading is largely based upon technical analysis.
| Company: | Independent |
| Address: | C1/3 Parth Indraprasth Towers. Vastrapur |
| Ahmedabad, Guj 380015 | |
| E-mail address: | chaitalimohile@yahoo.co.in |
Traders' Resource Links | |
| Independent has not added any product or service information to TRADERS' RESOURCE. | |
Click here for more information about our publications!
Comments
Date:�03/01/07Rank:�4Comment:�

Request Information From Our Sponsors
- StockCharts.com, Inc.
- Candle Patterns
- Candlestick Charting Explained
- Intermarket Technical Analysis
- John Murphy on Chart Analysis
- John Murphy's Chart Pattern Recognition
- John Murphy's Market Message
- MurphyExplainsMarketAnalysis-Intermarket Analysis
- MurphyExplainsMarketAnalysis-Visual Analysis
- StockCharts.com
- Technical Analysis of the Financial Markets
- The Visual Investor
- VectorVest, Inc.
- Executive Premier Workshop
- One-Day Options Course
- OptionsPro
- Retirement Income Workshop
- Sure-Fire Trading Systems (VectorVest, Inc.)
- Trading as a Business Workshop
- VectorVest 7 EOD
- VectorVest 7 RealTime/IntraDay
- VectorVest AutoTester
- VectorVest Educational Services
- VectorVest OnLine
- VectorVest Options Analyzer
- VectorVest ProGraphics v6.0
- VectorVest ProTrader 7
- VectorVest RealTime Derby Tool
- VectorVest Simulator
- VectorVest Variator
- VectorVest Watchdog