

HOT TOPICS LIST
- MACD
- Fibonacci
- RSI
- Gann
- ADXR
- Stochastics
- Volume
- Triangles
- Futures
- Cycles
- Volatility
- ZIGZAG
- MESA
- Retracement
- Aroon
INDICATORS LIST
LIST OF TOPICS
PRINT THIS ARTICLE
by Dennis D. Peterson
In Part II you will find the mathematical and Metastock formulas for VIDYA, the variable index dynamic average.
Position: N/A
Dennis D. Peterson
Market index trading on a daily basis.
PRINT THIS ARTICLE
VOLATILITY
VIDYA and the Nasdaq (Part II)
11/14/00 02:18:41 PMby Dennis D. Peterson
In Part II you will find the mathematical and Metastock formulas for VIDYA, the variable index dynamic average.
Position: N/A
| In order to provide a variable period exponential moving average I employ the basic definition of an exponential moving average using "n" time periods which is (Today's close) * ("n" percentage) + (Yesterday's average) * (1- "n" percentage), where "n" percentage is 2/( "n" time periods +1). Chande and Kroll modify the percentage by multiplying n by a volatility index. When the volatility is high, the volatility index needs to be high and therefore today's close will have a large weight compared to previous values. The opposite applies when volatility is low. So, VIDYA = (Today's close) * ("n" percentage * volatility index ) + (Yesterday's average) * (1- "n" percentage *volatility index). Calculate upper and lower bands as 1.01*VIDYA and 0.99*VIDYA respectively, that is 1% above and below VIDYA. The first issue is volatility. Two candidates are: (1) CMO, the Chande Momentum Oscillator, and (2) the ratio of standard deviations of price, with the numerator being for a recent period and the denominator being a historical standard deviation. The formula for CMO is CMO = 100((Su - Sd)/(Su + Sd)), Where Su is sum of today's price - yesterday's price for the user chosen number of days when today's price is greater than yesterday's, and Sd is sum of yesterday's price - today's price for the user chosen number of days when today's price is less than yesterdays. We will need the absolute value to be able to use an index. In the Metastock formula's below, Su is CMO1 and Sd is CMO2, and user chosen number of days is SP. To calculate the percentage, I divide the value by 100. The last line in the formula, kCMO, creates a plot of KCMO. SP{smoothing period}:=Input("Enter CMO periods",1,100,12); CMO1:=Sum(If(C,>,Ref(C,-1),(C-Ref(C,-1)),0),SP); CMO2:=Sum(If(C,<,Ref(C,-1),(Ref(C,-1)-C),0),SP); CMOFinal:= 100*(Abs(CMO1-CMO2)/(CMO1+CMO2)); kCMO:=CMOFinal/100; kCMO An observation about CMO is that when prices go into a tight price channel, the two sums, Su and Sd, could be nearly equal which means that the fraction will be small, which means the weight given today's close is going to be small. Alternatively you could use the ratio of historical standard deviations of price volatility to the recent standard deviation of price volatility: k = standard deviation ( closes over n periods )/ standard deviation (closes over a "historical reference"). In Metastock, use SP{smoothing period}:=Input("Enter Std Deviation Period",1,100,12); k:=Stdev(CLOSE,SP)/Stdev(CLOSE,2*SP); k with SP being the users choice for a period to calculate the two ratios of standard deviation (Stdev). I choose the historical reference period to be twice as long (2*SP) as the recent volatility. I also chose SP to be the default of 12. I plotted k by virtue of the last statement. A small artifice is needed to calculate VIDYA and the Metastock formula is If (cum(1)<=(smoothing period for volatility index +1), today's close ,VIDYA), where VIDYA is defined as above. The artifice of the "If" statement is that VIDYA is the closing price after passing the smoothing period plus one day. If you are using data of hundreds of days then starting a few days after the initial starting point is going to have minimal effect on the final results. Below is the Metastock formula calculated using the two volatility indexes given above. The use of {} in Metastock means the text between { and } is a comment. You will notice that I have commented a number of items that could be plotted. The form you see here plots only the VIDYA bands using the ratio of standard deviations. You will also notice I wanted to see how the modified percentage translated back into periods by using the formula time periods = 2/percentage - 1. Readers will find that CMO can lead to period lengths in thousands of days. But in terms of a percentage it just means that today's close is given very little weight. |
| SP{smoothing period}:=Input("Enter CMO periods",1,100,12); CMO1:=Sum(If(C,>,Ref(C,-1),(C-Ref(C,-1)),0),SP); CMO2:= Sum(If(C,<,Ref(C,-1),(Ref(C ,-1)-C),0),SP); CMOFinal:= 100*(Abs(CMO1-CMO2)/(CMO1+CMO2)); kCMO:=CMOFinal/100; k:=Stdev(CLOSE,SP)/Stdev(CLOSE,2*SP); N:=Input("Vidya smoothing constant",1,100,12); SC{smoothing constant %}:=2/(N+1); Percentage:=SC*kCMO; kPercentage:=SC*k; CMOPeriods:=Int(2/Percentage)-1; kperiods:=Int(2/kPercentage)-1; {CMOPeriods}; {kperiods}; VidyaC:=If(Cum(1)<=(SP+1),C,(SC*kCMO*C)+(1-(SC*kCMO))*PREV); Vidyak:=If(Cum(1)<=(SP+1),C,(SC*k*C)+(1-(SC*k))*PREV); Upperband:=(1.01*VidyaC); Lowerband:=(0.99*VidyaC); Upperbandk:=(1.01*Vidyak); Lowerbandk:=(0.99*Vidyak); {Upperband; Lowerband}; Upperbandk; Lowerbandk; |
|
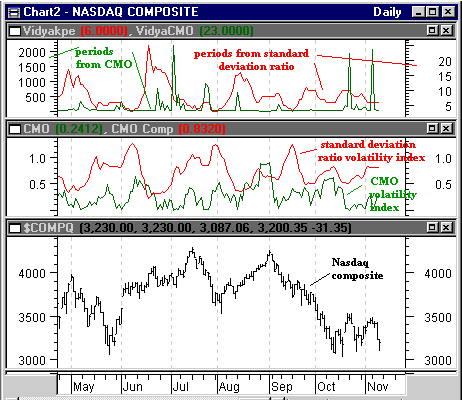
| Figure 1: Nasdaq May 2000 to current (lower chart), CMO and standard deviation volatility indexes (middle chart), equivalent periods for the two volatility indexes (top chart). |
| Graphic provided by: MetaStock. |
| |
| What we see is that CMO (green in middle and upper charts) is an index that can go to nearly zero and stays below one, which means that today's close will never be given a full weight and sometimes nearly no weight for at least the last six months of the Nasdaq (CMO did reach .97 on 1/03/2000). When the CMO percentage is converted to periods you can see the periods are sometimes very low and can reach the thousands. It was this observation that made me think that CMO may be overly reactive. |
| Chande and Kroll in their book suggested using the ratio of standard deviations. The result is an index that does not move as quickly, can be greater than one, and almost always gives more weight to today's close than CMO. Another observation that made me nervous was that the two disagreed in September. The ratio of standard deviations reaches a peak in mid-September while CMO does not. Does that make sense? Looking at the length of daily bars in August versus September says September was more volatile than August. When I charted the two methods I preferred using standard deviations, because it gave me faster signals. In the final form of the formula it is the standard deviation-based VIDYA bands that are plotted. Move the {}'s around and use the CMO based VIDYA bands if you want something a bit slower and possibly more reliable. |
Market index trading on a daily basis.
| Title: | Staff Writer |
| Company: | Technical Analysis, Inc. |
| Address: | 4757 California Ave SW |
| Seattle, WA 98116-4499 | |
| Phone # for sales: | 206 938 0570 |
| Fax: | 206 938 1307 |
| Website: | www.traders.com |
| E-mail address: | dpeterson@traders.com |
Traders' Resource Links | |
| Charting the Stock Market: The Wyckoff Method -- Books | |
| Working-Money.com -- Online Trading Services | |
| Traders.com Advantage -- Online Trading Services | |
| Technical Analysis of Stocks & Commodities -- Publications and Newsletters | |
| Working Money, at Working-Money.com -- Publications and Newsletters | |
| Traders.com Advantage -- Publications and Newsletters | |
| Professional Traders Starter Kit -- Software | |
Click here for more information about our publications!
Comments

Request Information From Our Sponsors
- StockCharts.com, Inc.
- Candle Patterns
- Candlestick Charting Explained
- Intermarket Technical Analysis
- John Murphy on Chart Analysis
- John Murphy's Chart Pattern Recognition
- John Murphy's Market Message
- MurphyExplainsMarketAnalysis-Intermarket Analysis
- MurphyExplainsMarketAnalysis-Visual Analysis
- StockCharts.com
- Technical Analysis of the Financial Markets
- The Visual Investor
- VectorVest, Inc.
- Executive Premier Workshop
- One-Day Options Course
- OptionsPro
- Retirement Income Workshop
- Sure-Fire Trading Systems (VectorVest, Inc.)
- Trading as a Business Workshop
- VectorVest 7 EOD
- VectorVest 7 RealTime/IntraDay
- VectorVest AutoTester
- VectorVest Educational Services
- VectorVest OnLine
- VectorVest Options Analyzer
- VectorVest ProGraphics v6.0
- VectorVest ProTrader 7
- VectorVest RealTime Derby Tool
- VectorVest Simulator
- VectorVest Variator
- VectorVest Watchdog