HOT TOPICS LIST
- MACD
- Fibonacci
- RSI
- Gann
- ADXR
- Stochastics
- Volume
- Triangles
- Futures
- Cycles
- Volatility
- ZIGZAG
- MESA
- Retracement
- Aroon
INDICATORS LIST
LIST OF TOPICS
PRINT THIS ARTICLE
by David Penn
Will a key Fibonacci retracement level provide support for the falling S&P 500?
Position: N/A
David Penn
Technical Writer for Technical Analysis of STOCKS & COMMODITIES magazine, Working-Money.com, and Traders.com Advantage.
PRINT THIS ARTICLE
REVERSAL
The S&P 500's Fibonacci Foraging For A Bottom
02/27/07 08:48:50 AMby David Penn
Will a key Fibonacci retracement level provide support for the falling S&P 500?
Position: N/A
| The past few days have seen the Standard & Poor's 500 move lower in a nauseatingly choppy fashion. After shooting up like a rocket in mid-month, the S&P 500 got toppy in the second half of February and began to move lower as the month drew toward a close. |

|
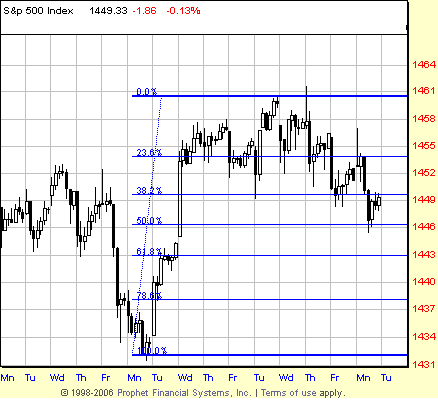
| FIGURE 1: S&P 500, HOURLY. The correction in the S&P 500, which began in the last full week of February, has retraced approximately 50% of its recent rally. |
| Graphic provided by: Prophet Financial, Inc. |
| |
| It has been a far from comfortable decline in the S&P 500. As Figure 1 shows, the market has moved lower in the sort of jagged, sawtooth pattern reminiscent of the sort of "double 3" corrections that Elliotticians often write about. While this conversation about the correction in the S&P 500 owes little to EW analysis, the similarity of the current correction to the EW "double 3" does underscore my sense that the move lower is just that: a correction to a market that is likely to move higher in the near term. |
| How near? Having already retraced 50% of the previous advance, the S&P 500 is moving into territory where potential support from a number of sources is likely to stem further significant declines from these levels. That potential support comes in the form of the 50% retracement level most immediately. But as the price action in Figure 1 shows, even failing support at 50% leaves the possibility of support at 1443, the 61.8% retracement level. This level also coincides — roughly — with the gap from the opening hour of trading on Valentine's Day, February 14, as well as the support left behind from various previous attempts to move lower on February 6 and 8. Still another way of seeing potential support at 1443 comes from subtracting the width of the February 14–22 correction (approximately 9 points, excluding an intrahour spike to the downside in the first hour of trading on February 20) from the value at the low of the correction, or 1452, a level that was not breached on an hourly closing basis until the breakdown during the first hour of trading on February 23. |

|
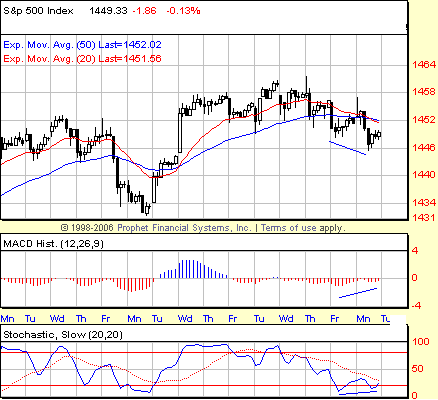
| FIGURE 2: S&P 500, HOURLY. Whether or not the positive divergences in the moving average convergence/divergence (MACD) histogram and stochastic are marking a bottom at current levels (roughly the 50% retracement level), they do indicate a loss of momentum to the downside that will be part of the process of establishing a bottom sooner than later. |
| Graphic provided by: Prophet Financial, Inc. |
| |
| The more I look at the pattern of selling in the second half of February, the more convinced I am that the sellers appear suspiciously eager to unload stocks. The last four days of the correction have featured either immediate, wide-range selling right at the open or, on the other hand, first-hour "fool's rallies" that result in shooting star candlestick patterns and almost instantaneous reversals to the downside. Even earlier in the consolidation this tendency could be readily observed. While anybody can sell at the opening bell for any reason, I suspect this is less the behavior of short-sellers staking out positions and more the behavior of profitable traders taking a few chips off the table to lock in gains in a market that, while advancing since the summer of 2006, has been less than profligate in distributing gains. |
| I'm not sure if the current divergences, shown and marked in Figure 2, have heralded the bottom in the S&P 500's correction. My suspicion is that one more move down toward the 61.8% retracement level at 1443 will be required before the correction runs its course. In any event, given the rally that preceded the correction, any true move back to the upside and resumption of the uptrend is likely to be a robust one, indeed. |
Technical Writer for Technical Analysis of STOCKS & COMMODITIES magazine, Working-Money.com, and Traders.com Advantage.
| Title: | Technical Writer |
| Company: | Technical Analysis, Inc. |
| Address: | 4757 California Avenue SW |
| Seattle, WA 98116 | |
| Phone # for sales: | 206 938 0570 |
| Fax: | 206 938 1307 |
| Website: | www.Traders.com |
| E-mail address: | DPenn@traders.com |
Traders' Resource Links | |
| Charting the Stock Market: The Wyckoff Method -- Books | |
| Working-Money.com -- Online Trading Services | |
| Traders.com Advantage -- Online Trading Services | |
| Technical Analysis of Stocks & Commodities -- Publications and Newsletters | |
| Working Money, at Working-Money.com -- Publications and Newsletters | |
| Traders.com Advantage -- Publications and Newsletters | |
| Professional Traders Starter Kit -- Software | |
Click here for more information about our publications!
Comments
Date: 02/27/07Rank: 3Comment:

|

Request Information From Our Sponsors
- StockCharts.com, Inc.
- Candle Patterns
- Candlestick Charting Explained
- Intermarket Technical Analysis
- John Murphy on Chart Analysis
- John Murphy's Chart Pattern Recognition
- John Murphy's Market Message
- MurphyExplainsMarketAnalysis-Intermarket Analysis
- MurphyExplainsMarketAnalysis-Visual Analysis
- StockCharts.com
- Technical Analysis of the Financial Markets
- The Visual Investor
- VectorVest, Inc.
- Executive Premier Workshop
- One-Day Options Course
- OptionsPro
- Retirement Income Workshop
- Sure-Fire Trading Systems (VectorVest, Inc.)
- Trading as a Business Workshop
- VectorVest 7 EOD
- VectorVest 7 RealTime/IntraDay
- VectorVest AutoTester
- VectorVest Educational Services
- VectorVest OnLine
- VectorVest Options Analyzer
- VectorVest ProGraphics v6.0
- VectorVest ProTrader 7
- VectorVest RealTime Derby Tool
- VectorVest Simulator
- VectorVest Variator
- VectorVest Watchdog
