HOT TOPICS LIST
- MACD
- Fibonacci
- RSI
- Gann
- ADXR
- Stochastics
- Volume
- Triangles
- Futures
- Cycles
- Volatility
- ZIGZAG
- MESA
- Retracement
- Aroon
INDICATORS LIST
LIST OF TOPICS
PRINT THIS ARTICLE
by David Penn
Trapped in a trading range since early November, is the NASDAQ 100's tracking stock finally ready to move higher?
Position: N/A
David Penn
Technical Writer for Technical Analysis of STOCKS & COMMODITIES magazine, Working-Money.com, and Traders.com Advantage.
PRINT THIS ARTICLE
BREAKOUTS
Is The QQQQ Breakout At Hand?
02/21/07 03:21:52 PMby David Penn
Trapped in a trading range since early November, is the NASDAQ 100's tracking stock finally ready to move higher?
Position: N/A
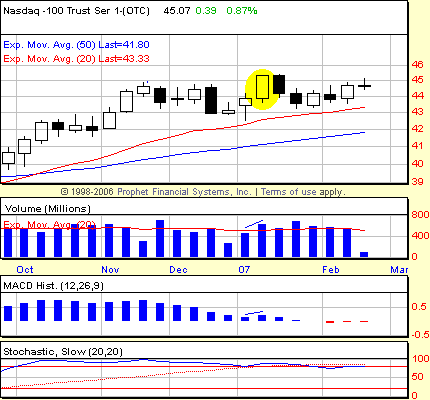
| QQQQ traders were cruelly teased in early January 2007, as what appeared to be a picture-perfect setup for a breakout one week turned into a false move by the next, as the QQQQ sank back into its roughly three-point trading range. |

|
| FIGURE 1: NASDAQ 100 TRUST SERIES (QQQQ), WEEKLY. An M-m-M pattern in the MACD histogram signals a buying opportunity in the weekly QQQQ in early January. Note that the bounce in the MACD (from "m" to "M") comes with a dramatic increase in volume. A weekly close above the high of the "M" week (highlighted by an oval) would have strongly suggested higher prices to come. |
| Graphic provided by: Prophet Financial, Inc. |
| |
| Figure 1 shows how the QQQQ was set up for a breakout, but failed. The move higher in the second week of January did not get the necessary follow-through in subsequent weeks — specifically a weekly close above 45.35. Even a daily close above that level would have provided an entry for more aggressive QQQQ traders. Yet the high daily close in the weeks following the breakout was 45.28 on January 16 — close, but no cigar and no trade. |
| The last time the moving average convergence/divergence (MACD) histogram provided a weekly signal was in the M-m-M pattern in late October/early November 2006 that led to a long position at either 44.30 as of the close on November 17 (if the follow-through weekly close was used) or 43.46 as of the close on November 13 (if the follow-through daily close was used). Incidentally, the low point since those entries was the daily closing low on 42.93 on December 22. |
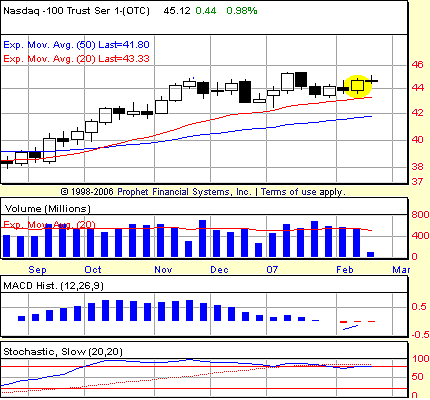
| Is the NASDAQ 100, as measured by the QQQQ, setting up for another breakout? Looking again at the weekly charts, we can see another bullish pattern developing, though this one is more of the P-p-P variety (quick note: M-m-M patterns arise out of overbought conditions in the MACD histogram, while P-p-P patterns arise out of oversold conditions. See my Working-Money.com articles "Trading The MACD Histogram," parts I and II, for more). Specifically, the weekly chart (Figure 2) is signaling an opportunity based on the MACD histogram pivot low of the first week of February (the "p" in the bullish "P-p-P" pattern). |

|
| FIGURE 2: NASDAQ 100 TRUST SERIES (QQQQ), WEEKLY. A P-p-P pattern in February sets up another opportunity for the QQQQ to break out above its three-month consolidation range. A weekly close above 44.86 would provide optimal confirmation — although more aggressive traders could reasonably pursue a daily close above that level. |
| Graphic provided by: Prophet Financial, Inc. |
| |
| QQQQ traders have been here before, as I've indicated, so there's no reason for giddiness. However, as I write this, it appears as if the QQQQ is headed for a daily close above that key 44.86 level. Should this price action hold up, aggressive traders following the weekly signal will have an opportunity to play the potential for a breakout days (and perhaps points) before the signal is confirmed by a weekly close above that level. That aggression in the trade mentioned previously was worth an extra point, particularly valuable for shorter-term traders. It will be interesting to see, as I have noticed in the past with other charts, if any daily close above 44.86 is accompanied by the kind of strong volume that suggests that traders have an idea of what is coming next — and want to be a big part of it as well. |
Technical Writer for Technical Analysis of STOCKS & COMMODITIES magazine, Working-Money.com, and Traders.com Advantage.
| Title: | Technical Writer |
| Company: | Technical Analysis, Inc. |
| Address: | 4757 California Avenue SW |
| Seattle, WA 98116 | |
| Phone # for sales: | 206 938 0570 |
| Fax: | 206 938 1307 |
| Website: | www.Traders.com |
| E-mail address: | DPenn@traders.com |
Traders' Resource Links | |
| Charting the Stock Market: The Wyckoff Method -- Books | |
| Working-Money.com -- Online Trading Services | |
| Traders.com Advantage -- Online Trading Services | |
| Technical Analysis of Stocks & Commodities -- Publications and Newsletters | |
| Working Money, at Working-Money.com -- Publications and Newsletters | |
| Traders.com Advantage -- Publications and Newsletters | |
| Professional Traders Starter Kit -- Software | |
Click here for more information about our publications!
Comments
Date: 02/22/07Rank: 3Comment:

Request Information From Our Sponsors
- StockCharts.com, Inc.
- Candle Patterns
- Candlestick Charting Explained
- Intermarket Technical Analysis
- John Murphy on Chart Analysis
- John Murphy's Chart Pattern Recognition
- John Murphy's Market Message
- MurphyExplainsMarketAnalysis-Intermarket Analysis
- MurphyExplainsMarketAnalysis-Visual Analysis
- StockCharts.com
- Technical Analysis of the Financial Markets
- The Visual Investor
- VectorVest, Inc.
- Executive Premier Workshop
- One-Day Options Course
- OptionsPro
- Retirement Income Workshop
- Sure-Fire Trading Systems (VectorVest, Inc.)
- Trading as a Business Workshop
- VectorVest 7 EOD
- VectorVest 7 RealTime/IntraDay
- VectorVest AutoTester
- VectorVest Educational Services
- VectorVest OnLine
- VectorVest Options Analyzer
- VectorVest ProGraphics v6.0
- VectorVest ProTrader 7
- VectorVest RealTime Derby Tool
- VectorVest Simulator
- VectorVest Variator
- VectorVest Watchdog
