HOT TOPICS LIST
- MACD
- Fibonacci
- RSI
- Gann
- ADXR
- Stochastics
- Volume
- Triangles
- Futures
- Cycles
- Volatility
- ZIGZAG
- MESA
- Retracement
- Aroon
INDICATORS LIST
LIST OF TOPICS
PRINT THIS ARTICLE
by Gary Grosschadl
After hitting a two-year high in the mid-$30 range and a low of $16, where is this stock headed?
Position: Buy
Gary Grosschadl
Independent Canadian equities trader and technical analyst based in Peterborough
Ontario, Canada.
PRINT THIS ARTICLE
HEAD & SHOULDERS
Verisign Nears A Pattern Test
02/21/07 09:48:28 AMby Gary Grosschadl
After hitting a two-year high in the mid-$30 range and a low of $16, where is this stock headed?
Position: Buy
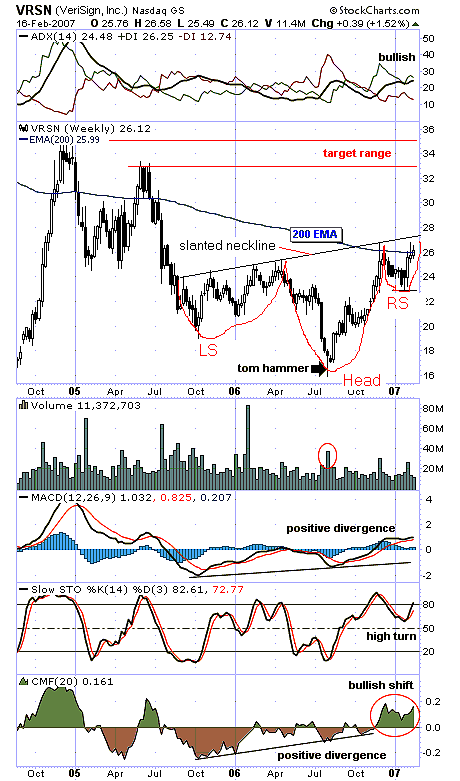
| Figure 1 shows a large head & shoulders bottom with a slanted neckline. Note the classic candlestick bottom hammer that marked a reversal point at the head. |
| What is interesting here is a hint that the neckline will be successfully broken to the upside. Note how the stock closed above the ever-important 200-period EMA for the first time in nearly 18 months. This may be an important harbinger of things to come. Confirmation of this optimism will be a sustained close above the neckline. |

|
| FIGURE 1: VERISIGN, WEEKLY. This chart shows an interesting pattern hinting at upside potential. |
| Graphic provided by: StockCharts.com. |
| |
| The upside target range is mused at $33–$36. This is determined by the previous high-water marks and the completion target of this head & shoulder pattern. The fulfillment target of any head & shoulders pattern is a move equal to the distance between the neckline and the bottom hammer. This is roughly 10 points and would equate to $36, just beyond the previous peaks. |
| Several indicators are considered. The directional movement indicator is bullish with its three components bullish poised. The average directional movement index (ADX) is upsloping above 25, the DIs (directional indicators) is either side of the ADX, and the positive (+DI) above its negative counterpart. Below the chart, the moving average convergence/divergence (MACD) is bullishly above its zero-line. Note the telling positive divergence relating to the head or bottom. The stochastic oscillator shows a bullish high turn while the Chaikin money flow indicator (CMF) also shows a powerful divergence and a bullish shift to buying power. All this seems to bode well, so watch for a likely bullish outcome at the neckline. |
Independent Canadian equities trader and technical analyst based in Peterborough
Ontario, Canada.
| Website: | www.whatsonsale.ca/financial.html |
| E-mail address: | gwg7@sympatico.ca |
Click here for more information about our publications!
Comments
Date: 02/22/07Rank: 5Comment:

Request Information From Our Sponsors
- StockCharts.com, Inc.
- Candle Patterns
- Candlestick Charting Explained
- Intermarket Technical Analysis
- John Murphy on Chart Analysis
- John Murphy's Chart Pattern Recognition
- John Murphy's Market Message
- MurphyExplainsMarketAnalysis-Intermarket Analysis
- MurphyExplainsMarketAnalysis-Visual Analysis
- StockCharts.com
- Technical Analysis of the Financial Markets
- The Visual Investor
- VectorVest, Inc.
- Executive Premier Workshop
- One-Day Options Course
- OptionsPro
- Retirement Income Workshop
- Sure-Fire Trading Systems (VectorVest, Inc.)
- Trading as a Business Workshop
- VectorVest 7 EOD
- VectorVest 7 RealTime/IntraDay
- VectorVest AutoTester
- VectorVest Educational Services
- VectorVest OnLine
- VectorVest Options Analyzer
- VectorVest ProGraphics v6.0
- VectorVest ProTrader 7
- VectorVest RealTime Derby Tool
- VectorVest Simulator
- VectorVest Variator
- VectorVest Watchdog
