

HOT TOPICS LIST
- MACD
- Fibonacci
- RSI
- Gann
- ADXR
- Stochastics
- Volume
- Triangles
- Futures
- Cycles
- Volatility
- ZIGZAG
- MESA
- Retracement
- Aroon
INDICATORS LIST
LIST OF TOPICS
PRINT THIS ARTICLE
by Gary Grosschadl
The stock price hit a two-year low last August. Is it recovering?
Position: Buy
Gary Grosschadl
Independent Canadian equities trader and technical analyst based in Peterborough
Ontario, Canada.
PRINT THIS ARTICLE
ANDREWS PITCH-FORK
eBay Hints At A Trend Change
02/21/07 09:43:05 AMby Gary Grosschadl
The stock price hit a two-year low last August. Is it recovering?
Position: Buy
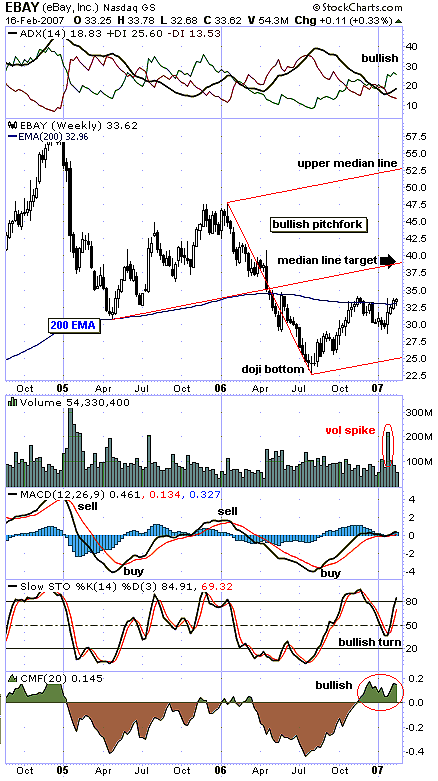
| In the first eight months of 2006, eBay lost more than 50% of its share price, moving down from $48 to $23. Note the doji bottom in August (Figure 1). The small cross of the doji often marks a reversal after a significant rise or fall. |
| A pitchfork or Andrews line is plotted on this weekly chart, suggesting that there may have been a bullish trend change. Using three significant turning points, the result takes the shape of a bullish-pointing pitchfork. Pitchfork theory holds that the stock price travel between the tines of the fork with an eventual test of the median line (center tine). Should a bear trend ensue, the bottom tine or lower median line would be violated. Until that happens, an uptrend is in effect. The current median line target is near $40. Under super bull conditions, the stock could make its way toward the upper median line (currently 52.50). |
|
| FIGURE 1: EBAY, WEEKLY. This chart shows a bullish pitchfork. |
| Graphic provided by: StockCharts.com. |
| |
| The other main encouraging sign is the move above the ever-relevant 200-period exponential moving average (EMA). The last attempt was repelled late last year, but a second close above this mark occurring now should be more promising. Note the large volume spike several weeks ago that seemed to hint at something developing. |
| Several indicators are also examined. The directional movement indicator at the top of the chart is assuming a bullish stance with an upsloping average directional movement index (ADX) between the DIs (directional indicators), with the positive (green) +DI being overhead. The moving average convergence/divergence (MACD) shows a compelling pattern of timely buy and sell signals with its crossovers. Currently, it seems to be successfully testing the zero-line. The stochastic oscillator shows a recent bullish turn near the 50 line, while the Chaikin money flow indicator (CMF) shows a bullish swing to positive buying pressure. |
| Short- to medium-term traders may anticipate a median line target near $40, especially if the 200-day EMA now acts as support going forward. The fly in the ointment could be a test of the lower median line, should this stab above the 200-day EMA be once again thwarted. |
Independent Canadian equities trader and technical analyst based in Peterborough
Ontario, Canada.
| Website: | www.whatsonsale.ca/financial.html |
| E-mail address: | gwg7@sympatico.ca |
Click here for more information about our publications!
Comments
Date:�02/22/07Rank:�5Comment:�

Request Information From Our Sponsors
- StockCharts.com, Inc.
- Candle Patterns
- Candlestick Charting Explained
- Intermarket Technical Analysis
- John Murphy on Chart Analysis
- John Murphy's Chart Pattern Recognition
- John Murphy's Market Message
- MurphyExplainsMarketAnalysis-Intermarket Analysis
- MurphyExplainsMarketAnalysis-Visual Analysis
- StockCharts.com
- Technical Analysis of the Financial Markets
- The Visual Investor
- VectorVest, Inc.
- Executive Premier Workshop
- One-Day Options Course
- OptionsPro
- Retirement Income Workshop
- Sure-Fire Trading Systems (VectorVest, Inc.)
- Trading as a Business Workshop
- VectorVest 7 EOD
- VectorVest 7 RealTime/IntraDay
- VectorVest AutoTester
- VectorVest Educational Services
- VectorVest OnLine
- VectorVest Options Analyzer
- VectorVest ProGraphics v6.0
- VectorVest ProTrader 7
- VectorVest RealTime Derby Tool
- VectorVest Simulator
- VectorVest Variator
- VectorVest Watchdog