

HOT TOPICS LIST
- MACD
- Fibonacci
- RSI
- Gann
- ADXR
- Stochastics
- Volume
- Triangles
- Futures
- Cycles
- Volatility
- ZIGZAG
- MESA
- Retracement
- Aroon
INDICATORS LIST
LIST OF TOPICS
PRINT THIS ARTICLE
by Arthur Hill
CNET gapped up at the end of January, and last week's flag breakout could foreshadow long-term trend change.
Position: Accumulate
Arthur Hill
Arthur Hill is currently editor of TDTrader.com, a website specializing in trading strategies, sector/industry specific breadth stats and overall technical analysis. He passed the Society of Technical Analysts (STA London) diploma exam with distinction is a Certified Financial Technician (CFTe). Prior to TD Trader, he was the Chief Technical Analyst for Stockcharts.com and the main contributor to the ChartSchool.
PRINT THIS ARTICLE
GAPS
A Surge For CNET
02/20/07 12:05:22 PMby Arthur Hill
CNET gapped up at the end of January, and last week's flag breakout could foreshadow long-term trend change.
Position: Accumulate
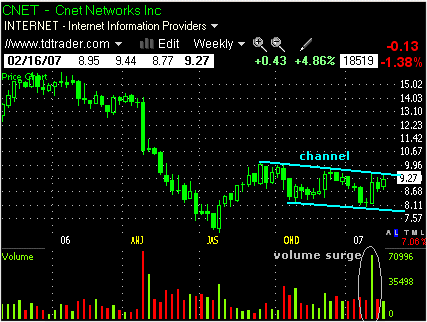
| CNET declined sharply from early December 2006 to late January 2007 and then gapped higher on January 30. The gap featured big volume, and this shows a sudden shift in sentiment. It looks like a breakaway gap and should be considered bullish as long as it holds. |
|
| FIGURE 1: CNET, WEEKLY. Note the resistance around 10. |
| Graphic provided by: Telechart 2007. |
| |
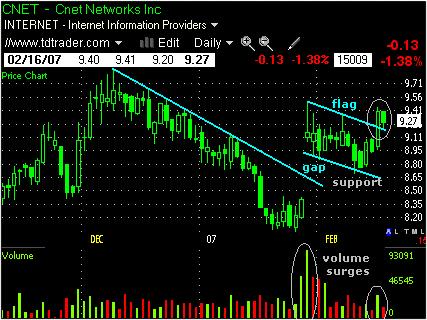
| There was a slight pullback in February, but the gap held and this pullback formed a falling flag. These patterns are typical for bullish corrections or consolidations and the stock broke above the upper flag trendline. The flag breakout signals a continuation of the late January gap/surge and targets further strength to 10.1 (9.5 - 8.1 = 1.4, 8.7 + 1.4 = 10.1). The flag breakout occurred on above-average volume and this further validates the breakout. |
|
| FIGURE 2: CNET, DAILY. The flag breakout holds the key. |
| Graphic provided by: Telechart 2007. |
| |
| The flag target is around 10.1 and the weekly chart showed lots of resistance around 10 (Figure 1). The stock surged from July to September and then declined over the last four to five months. A falling price channel evolved and the December reaction high marks resistance just below 10. The break above this high would forge a higher high and reverse the downtrend on the weekly chart. This would call for a continuation of the July–September advance and target further strength to around 13. |
| The flag breakout on the daily chart holds the key (Figure 2). This move occurred with a long white candlestick on good volume and the breakout is valid as long as it holds. A move below the low of the long white candlestick (8.97) would negate the breakout and call for a reassessment. |
Arthur Hill is currently editor of TDTrader.com, a website specializing in trading strategies, sector/industry specific breadth stats and overall technical analysis. He passed the Society of Technical Analysts (STA London) diploma exam with distinction is a Certified Financial Technician (CFTe). Prior to TD Trader, he was the Chief Technical Analyst for Stockcharts.com and the main contributor to the ChartSchool.
| Title: | Editor |
| Company: | TDTrader.com |
| Address: | Willem Geetsstraat 17 |
| Mechelen, B2800 | |
| Phone # for sales: | 3215345465 |
| Website: | www.tdtrader.com |
| E-mail address: | arthurh@tdtrader.com |
Traders' Resource Links | |
| TDTrader.com has not added any product or service information to TRADERS' RESOURCE. | |
Click here for more information about our publications!
Comments
Date:�02/23/07Rank:�4Comment:�

Request Information From Our Sponsors
- StockCharts.com, Inc.
- Candle Patterns
- Candlestick Charting Explained
- Intermarket Technical Analysis
- John Murphy on Chart Analysis
- John Murphy's Chart Pattern Recognition
- John Murphy's Market Message
- MurphyExplainsMarketAnalysis-Intermarket Analysis
- MurphyExplainsMarketAnalysis-Visual Analysis
- StockCharts.com
- Technical Analysis of the Financial Markets
- The Visual Investor
- VectorVest, Inc.
- Executive Premier Workshop
- One-Day Options Course
- OptionsPro
- Retirement Income Workshop
- Sure-Fire Trading Systems (VectorVest, Inc.)
- Trading as a Business Workshop
- VectorVest 7 EOD
- VectorVest 7 RealTime/IntraDay
- VectorVest AutoTester
- VectorVest Educational Services
- VectorVest OnLine
- VectorVest Options Analyzer
- VectorVest ProGraphics v6.0
- VectorVest ProTrader 7
- VectorVest RealTime Derby Tool
- VectorVest Simulator
- VectorVest Variator
- VectorVest Watchdog