HOT TOPICS LIST
- MACD
- Fibonacci
- RSI
- Gann
- ADXR
- Stochastics
- Volume
- Triangles
- Futures
- Cycles
- Volatility
- ZIGZAG
- MESA
- Retracement
- Aroon
INDICATORS LIST
LIST OF TOPICS
PRINT THIS ARTICLE
by Chaitali Mohile
Fossil, Inc., looks like it's ready to move. Traders can see a target of $31 soon.
Position: Buy
Chaitali Mohile
Active trader in the Indian stock markets since 2003 and a full-time writer. Trading is largely based upon technical analysis.
PRINT THIS ARTICLE
RSI
Fresh Levels In Fossil
02/27/07 10:57:05 AMby Chaitali Mohile
Fossil, Inc., looks like it's ready to move. Traders can see a target of $31 soon.
Position: Buy
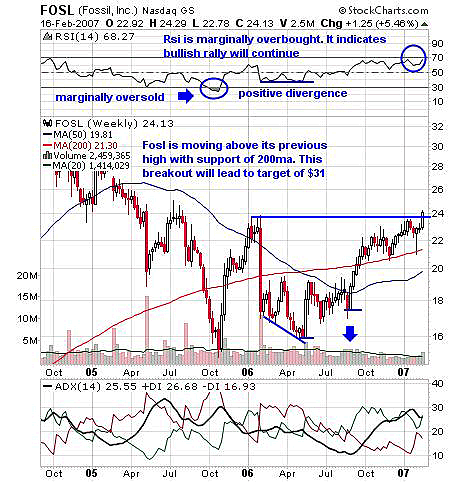
| Fossil, Inc. (FOSL), was moving under the resistance of its previous high of $24 (Figure 1). The stock was about to reach oversold levels when the price moved down from $24 to $15, but the relative strength index (RSI) (14) bounced from the 30 level and rallied to 70. As a result, traders can see a "V"-like move in the stock. The price also moved sharply toward the previous high. But due to a lack of strength, the RSI moved down to the 30 level, where it showed positive divergence. The price made a lower low, but the RSI held its 30-level support. |

|
| FIGURE 1: FOSSIL, WEEKLY. FOSL was about to go oversold when the price moved down from $24 to $15. |
| Graphic provided by: StockCharts.com. |
| |
| Traders should always remember that though the RSI gave positive divergence, fresh trades are always risky on divergences. Divergence should be used only as directional indicators. The effect of divergence can be seen as price made higher lows at $16 and $17 and again tested its previous high. The RSI at current levels is marginally overbought and thus can lead the fresh bullish rally ahead. For the price to move above $24 strongly, some increase in volume is necessary. The breakout will lead to new level of $ 31. This target is calculated on the previous rally from $17 to $24, so by adding $7 to $24, the target is calculated. |
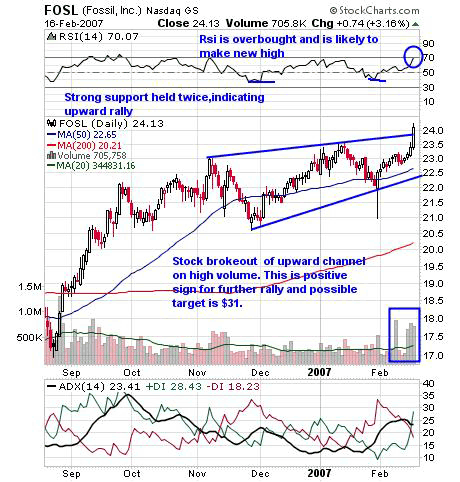
| In Figure 2, the stock is moving in an upward channel. This channel and the moving average direction indicates the uptrend of the stock. Whenever the price moved toward the lower line of channel, the RSI (14) too moved down to the 30 level. The RSI had established support twice, indicating the bullish strength of the rally. Finally, with increase volume the stock moved above the upper line of channel. This breakout will strengthen the move. The RSI at 70 is overbought, but traders can take long positions with the view of a breakout. At 50 level on the RSI, the buying opportunity was difficult because of trendline resistance. |

|
| FIGURE 2: FOSSIL, DAILY. FOSL appears to be in an uptrend. |
| Graphic provided by: StockCharts.com. |
| |
| Traders and investors may want to consider going long though the RSI is overbought, as the indicator has a tendency to remain overbought for longer periods. Trades can be made with the target of $31. |
Active trader in the Indian stock markets since 2003 and a full-time writer. Trading is largely based upon technical analysis.
| Company: | Independent |
| Address: | C1/3 Parth Indraprasth Towers. Vastrapur |
| Ahmedabad, Guj 380015 | |
| E-mail address: | chaitalimohile@yahoo.co.in |
Traders' Resource Links | |
| Independent has not added any product or service information to TRADERS' RESOURCE. | |
Click here for more information about our publications!
Comments
Date: 02/27/07Rank: 4Comment:

Request Information From Our Sponsors
- VectorVest, Inc.
- Executive Premier Workshop
- One-Day Options Course
- OptionsPro
- Retirement Income Workshop
- Sure-Fire Trading Systems (VectorVest, Inc.)
- Trading as a Business Workshop
- VectorVest 7 EOD
- VectorVest 7 RealTime/IntraDay
- VectorVest AutoTester
- VectorVest Educational Services
- VectorVest OnLine
- VectorVest Options Analyzer
- VectorVest ProGraphics v6.0
- VectorVest ProTrader 7
- VectorVest RealTime Derby Tool
- VectorVest Simulator
- VectorVest Variator
- VectorVest Watchdog
- StockCharts.com, Inc.
- Candle Patterns
- Candlestick Charting Explained
- Intermarket Technical Analysis
- John Murphy on Chart Analysis
- John Murphy's Chart Pattern Recognition
- John Murphy's Market Message
- MurphyExplainsMarketAnalysis-Intermarket Analysis
- MurphyExplainsMarketAnalysis-Visual Analysis
- StockCharts.com
- Technical Analysis of the Financial Markets
- The Visual Investor
