HOT TOPICS LIST
- MACD
- Fibonacci
- RSI
- Gann
- ADXR
- Stochastics
- Volume
- Triangles
- Futures
- Cycles
- Volatility
- ZIGZAG
- MESA
- Retracement
- Aroon
INDICATORS LIST
LIST OF TOPICS
PRINT THIS ARTICLE
by David Penn
Another example of the march forward in health-care providers comes courtesy of an intermediate-term 2B bottom in shares of Humana.
Position: N/A
David Penn
Technical Writer for Technical Analysis of STOCKS & COMMODITIES magazine, Working-Money.com, and Traders.com Advantage.
PRINT THIS ARTICLE
REVERSAL
Weekly 2B Bottom In Humana
02/20/07 11:21:58 AMby David Penn
Another example of the march forward in health-care providers comes courtesy of an intermediate-term 2B bottom in shares of Humana.
Position: N/A
| I recently wrote about the good fortunes of health-care provider stocks — both in terms of their favorable seasonal tendencies as well as the intermediate- to long-term technical picture ("High Hopes For New Highs In Health Care," Traders.com Advantage, February 15, 2007). |

|
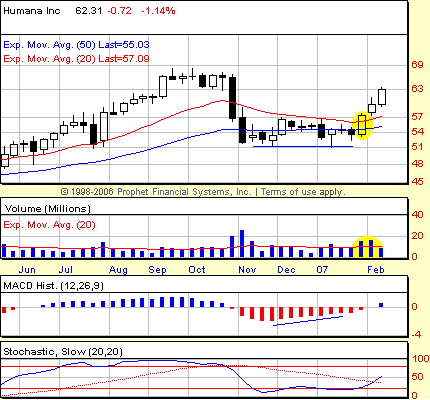
| FIGURE 1: HUMANA, INC., WEEKLY. A 2B bottom that developed during the November 2006–January 2007 consolidation in Humana led to an above-average volume breakout in late January and follow-through into February. The highlighted candlestick indicates the week of the long entry, when the high of the initial low (from late November) was exceeded. |
| Graphic provided by: Prophet Financial, Inc. |
| |
| Because that article was not the longer piece I'd intended to write, some of the stocks I'd wanted to highlight will end up getting ink of their own. One such stock is Humana, which emerged in late January from a three-month consolidation that developed after a sharp fall last October that sent the stock from the high to mid-60s to the low 50s (Figure 1). |
| That consolidation found Humana slipping below what would ordinarily be important long-term support in the form of the 50-week exponential moving average (EMA). However, it became increasingly clear that the 51 level would provide some support based in part on Humana's reaction every time it touched that level (note the lower tails or shadows on the candlesticks that test the 51 level). This level also appears to derive support from the closing weekly lows from the summer of 2006. |

|
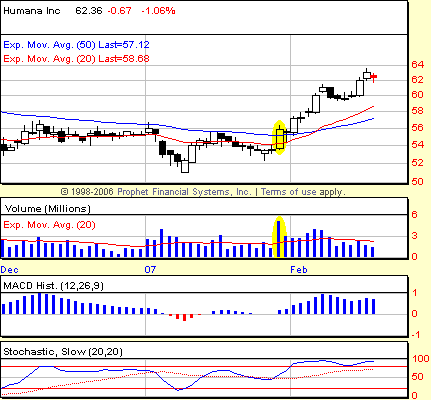
| FIGURE 2: HUMANA, INC., DAILY. The highlighted candlestick shows the actual day during which the long trade, signaled in the weekly chart, would have been initiated. Note the strong volume as HUM broke out above the 50-day EMA, closing above that level for the first time in many weeks. |
| Graphic provided by: Prophet Financial, Inc. |
| |
| The 2B bottom developed as Humana made a somewhat lower low in mid-January 2007 during the consolidation, a lower low vis-a-vis the low in late November 2006. When the stock did not follow through to the downside after the lower low in January, the opportunity for a 2B bottom appeared. When prices instead rallied above the high of the initial low from November, the breakout from the 2B bottom had arrived. Figure 2 shows where a trader would have gone long based on the weekly 2B bottom buy signal. What is particularly interesting is the way that day was accompanied by overwhelming volume, hinting that more than a few speculators thought that late January date was an especially good time to get long Humana. |
| My rule of thumb with 2B tops and bottoms (expressed recently in my Working-Money.com piece "Breakdowns, Pullbacks, And Gaming The 2B," January 24, 2007) is to use a time stop lasting half the time it took for the 2B to develop. In this case, the two lows in November and January were separated by about six weeks. That allows for about a three-week holding once the position is on — and likely profit-taking at the end of the week beginning February 12, or at the beginning of the week beginning February 19. |
Technical Writer for Technical Analysis of STOCKS & COMMODITIES magazine, Working-Money.com, and Traders.com Advantage.
| Title: | Technical Writer |
| Company: | Technical Analysis, Inc. |
| Address: | 4757 California Avenue SW |
| Seattle, WA 98116 | |
| Phone # for sales: | 206 938 0570 |
| Fax: | 206 938 1307 |
| Website: | www.Traders.com |
| E-mail address: | DPenn@traders.com |
Traders' Resource Links | |
| Charting the Stock Market: The Wyckoff Method -- Books | |
| Working-Money.com -- Online Trading Services | |
| Traders.com Advantage -- Online Trading Services | |
| Technical Analysis of Stocks & Commodities -- Publications and Newsletters | |
| Working Money, at Working-Money.com -- Publications and Newsletters | |
| Traders.com Advantage -- Publications and Newsletters | |
| Professional Traders Starter Kit -- Software | |
Click here for more information about our publications!
Comments
Date: 02/22/07Rank: 3Comment:

Request Information From Our Sponsors
- StockCharts.com, Inc.
- Candle Patterns
- Candlestick Charting Explained
- Intermarket Technical Analysis
- John Murphy on Chart Analysis
- John Murphy's Chart Pattern Recognition
- John Murphy's Market Message
- MurphyExplainsMarketAnalysis-Intermarket Analysis
- MurphyExplainsMarketAnalysis-Visual Analysis
- StockCharts.com
- Technical Analysis of the Financial Markets
- The Visual Investor
- VectorVest, Inc.
- Executive Premier Workshop
- One-Day Options Course
- OptionsPro
- Retirement Income Workshop
- Sure-Fire Trading Systems (VectorVest, Inc.)
- Trading as a Business Workshop
- VectorVest 7 EOD
- VectorVest 7 RealTime/IntraDay
- VectorVest AutoTester
- VectorVest Educational Services
- VectorVest OnLine
- VectorVest Options Analyzer
- VectorVest ProGraphics v6.0
- VectorVest ProTrader 7
- VectorVest RealTime Derby Tool
- VectorVest Simulator
- VectorVest Variator
- VectorVest Watchdog
