HOT TOPICS LIST
- MACD
- Fibonacci
- RSI
- Gann
- ADXR
- Stochastics
- Volume
- Triangles
- Futures
- Cycles
- Volatility
- ZIGZAG
- MESA
- Retracement
- Aroon
INDICATORS LIST
LIST OF TOPICS
PRINT THIS ARTICLE
by David Penn
Once again, negative divergences and failed follow-through after a new high hint at lower prices for shares of Disney.
Position: N/A
David Penn
Technical Writer for Technical Analysis of STOCKS & COMMODITIES magazine, Working-Money.com, and Traders.com Advantage.
PRINT THIS ARTICLE
REVERSAL
A Temporary Top In Disney?
02/15/07 03:04:17 PMby David Penn
Once again, negative divergences and failed follow-through after a new high hint at lower prices for shares of Disney.
Position: N/A
| Disney (DIS) is one of the Dow stocks that I have been watching ever since it gave a weekly moving average convergence/divergence (MACD) histogram buy signal back in early January 2007. The entry price was about 35.50. At the time, Disney looked to be breaking out of a five-odd week consolidation, and a quick run to 37 seemed like the likely path the breakout would take. |

|
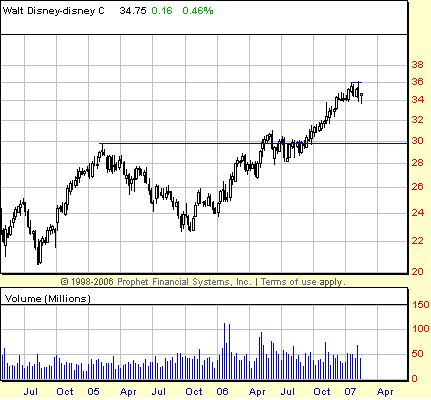
| FIGURE 1: WALT DISNEY CORP., WEEKLY. Rallying from a late 2005 bottom and breaking out during the summer of 2006, shares of Disney can be projected based on Stan Weinstein's swing rule to reach the 37 level. |
| Graphic provided by: Prophet Financial, Inc. |
| |
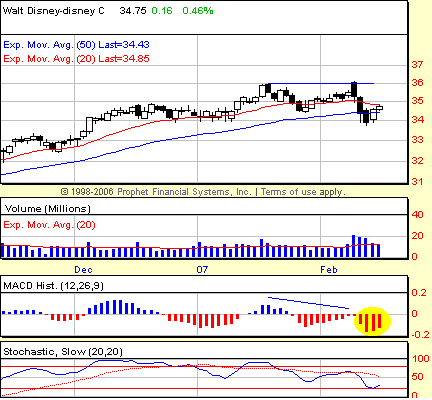
| As it turned out, Disney had more consolidating to do -- at least as its price action appears on the weekly chart (Figure 1), where the five-odd week sideways consolidation has edged into its 10th week. Disney broke free from the consolidation (which triggered the buy signal), but then slipped back into the tight two-point range shortly afterward. On the daily chart (Figure 2), the failed breakout appears much more dramatic. By way of the dailies, we can see how negative divergences in both the stochastic and the MACD histogram suggested that the higher high reached in February would likely be a trap and that sideways price action at best and downward price action at worst were more likely than follow-through to the upside. |
| The follow-through to the upside, in fact, did not occur, as the two peaks in January and February created instead a 2B top, as shown in Figure 2. In addition to the bearishness of two negative divergences and the inability or unwillingness of buyers to continue to push Disney after making the new high in February, the chart in Figure 2 shows that the second peak was itself a reversal day, in which the market opened at or near the top of what would become its daily range only to close near the bottom of that range. In and of itself, such candlesticks tend to signal lower prices ahead. In this context, that candlestick joins a chorus of bearish portent. |

|
| FIGURE 2: WALT DISNEY CORP., DAILY. The 2B top in Disney is accompanied by negative divergences in both the MACD histogram and the stochastic. Note also the increased volume during the selling in mid-February. That, combined with the depth of the histogram trough in mid-February, suggests that the stock has further to fall before its correction has run its course. |
| Graphic provided by: Prophet Financial, Inc. |
| |
| What sort of downside might Disney endure? Given the failed breakout, Disney has now created a sideways consolidation, two and a half months long, and two points wide at its widest point. We can also see from Figure 1 that Disney is likely to have significant support at 30, the level through which it broke out in the summer of 2006. The two recent updays in Disney were both accompanied by less-than-average volume, which puts into question the little bounce off of consolidation-low support at 34. Should this support give way, then a two-point drop to 32 should be the stock's next destination. |
| One last point: The distance between the two peaks in Disney is approximately 13 sessions (13 trading days). As I suggested in an article for Working Money ("Breakouts, Pullbacks, And Gaming The 2B," January 24, 2006), it is often a good idea to take something off the table within 50% of the time it took for the 2B pattern to develop. In this instance that would mean within six or seven days after the short trade is triggered the trader should be focused on limiting losses. This is helpful because not every 2B top represents a major change of trend and forcing the issue by remaining short can result in losses if the uptrend is resumed. As of this writing, DIS has three more days left, per this approach. |
Technical Writer for Technical Analysis of STOCKS & COMMODITIES magazine, Working-Money.com, and Traders.com Advantage.
| Title: | Technical Writer |
| Company: | Technical Analysis, Inc. |
| Address: | 4757 California Avenue SW |
| Seattle, WA 98116 | |
| Phone # for sales: | 206 938 0570 |
| Fax: | 206 938 1307 |
| Website: | www.Traders.com |
| E-mail address: | DPenn@traders.com |
Traders' Resource Links | |
| Charting the Stock Market: The Wyckoff Method -- Books | |
| Working-Money.com -- Online Trading Services | |
| Traders.com Advantage -- Online Trading Services | |
| Technical Analysis of Stocks & Commodities -- Publications and Newsletters | |
| Working Money, at Working-Money.com -- Publications and Newsletters | |
| Traders.com Advantage -- Publications and Newsletters | |
| Professional Traders Starter Kit -- Software | |
Click here for more information about our publications!
Comments
Date: 02/15/07Rank: 3Comment:

Request Information From Our Sponsors
- StockCharts.com, Inc.
- Candle Patterns
- Candlestick Charting Explained
- Intermarket Technical Analysis
- John Murphy on Chart Analysis
- John Murphy's Chart Pattern Recognition
- John Murphy's Market Message
- MurphyExplainsMarketAnalysis-Intermarket Analysis
- MurphyExplainsMarketAnalysis-Visual Analysis
- StockCharts.com
- Technical Analysis of the Financial Markets
- The Visual Investor
- VectorVest, Inc.
- Executive Premier Workshop
- One-Day Options Course
- OptionsPro
- Retirement Income Workshop
- Sure-Fire Trading Systems (VectorVest, Inc.)
- Trading as a Business Workshop
- VectorVest 7 EOD
- VectorVest 7 RealTime/IntraDay
- VectorVest AutoTester
- VectorVest Educational Services
- VectorVest OnLine
- VectorVest Options Analyzer
- VectorVest ProGraphics v6.0
- VectorVest ProTrader 7
- VectorVest RealTime Derby Tool
- VectorVest Simulator
- VectorVest Variator
- VectorVest Watchdog
