HOT TOPICS LIST
- MACD
- Fibonacci
- RSI
- Gann
- ADXR
- Stochastics
- Volume
- Triangles
- Futures
- Cycles
- Volatility
- ZIGZAG
- MESA
- Retracement
- Aroon
INDICATORS LIST
LIST OF TOPICS
PRINT THIS ARTICLE
by Gary Grosschadl
Caterpillar, Inc., is in the midst of a classic bottom pattern and is pushing higher.
Position: Hold
Gary Grosschadl
Independent Canadian equities trader and technical analyst based in Peterborough
Ontario, Canada.
PRINT THIS ARTICLE
DOUBLE BOTTOMS
CAT Leaps Higher
02/15/07 02:49:34 PMby Gary Grosschadl
Caterpillar, Inc., is in the midst of a classic bottom pattern and is pushing higher.
Position: Hold
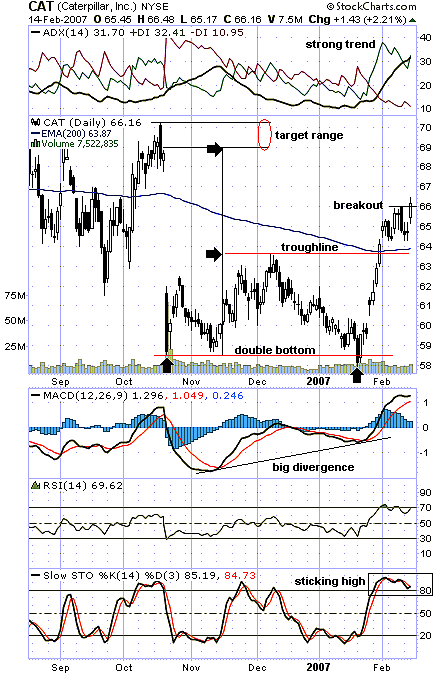
| This six months' daily chart (Figure 1) shows a double-bottom formation that was confirmed when the stock first closed above the troughline in late January. Note how this coincided with a break above the ever-important 200-day exponential moving average (EMA). A brief consolidation period followed, and now the stock is breaking higher. |
| With a double-bottom pattern, the completion target is a move above the trendline equal to the distance from the double bottom to this same trendline. This translates to a target near $69. Since it previously peaked just above $70, the target range is $69–$70. This does not mean it can't go higher, but this represents a trading target with likely profit-taking pressure. |

|
| FIGURE 1: CATERPILLAR, INC., DAILY. Caterpillar Inc. approaches its completion target. |
| Graphic provided by: StockCharts.com. |
| |
| Several indicators are examined. At the top of the chart, the components of the directional movement indicator (DMI) show a strong trend in place. The average directional movement index (ADX) is upsloping at 31.70. Above 20–25 is considered a strong trend by most traders. The moving average convergence/divergence (MACD) remains strong above the zero-line, even with the slope changing. Note the great positive divergence signal when the stock made its double bottom at $58. This served an excellent early buy signal for the intrepid bottom-pickers. Meanwhile, the relative strength index (RSI) and the stochastic oscillator are in overbought territory, but both indicators can stick high for an extended period when a strong trend is in place. |
| In summary, the stock is nearing the pattern completion target. Should a surprise reversal occur, the 200-day EMA would have to hold support for any hope of another upleg being launched from reasonable levels. Future 200-day EMA support could be another opportunity for new bulls to enter the market. |
Independent Canadian equities trader and technical analyst based in Peterborough
Ontario, Canada.
| Website: | www.whatsonsale.ca/financial.html |
| E-mail address: | gwg7@sympatico.ca |
Click here for more information about our publications!
Comments
Date: 02/15/07Rank: 5Comment:

Request Information From Our Sponsors
- VectorVest, Inc.
- Executive Premier Workshop
- One-Day Options Course
- OptionsPro
- Retirement Income Workshop
- Sure-Fire Trading Systems (VectorVest, Inc.)
- Trading as a Business Workshop
- VectorVest 7 EOD
- VectorVest 7 RealTime/IntraDay
- VectorVest AutoTester
- VectorVest Educational Services
- VectorVest OnLine
- VectorVest Options Analyzer
- VectorVest ProGraphics v6.0
- VectorVest ProTrader 7
- VectorVest RealTime Derby Tool
- VectorVest Simulator
- VectorVest Variator
- VectorVest Watchdog
- StockCharts.com, Inc.
- Candle Patterns
- Candlestick Charting Explained
- Intermarket Technical Analysis
- John Murphy on Chart Analysis
- John Murphy's Chart Pattern Recognition
- John Murphy's Market Message
- MurphyExplainsMarketAnalysis-Intermarket Analysis
- MurphyExplainsMarketAnalysis-Visual Analysis
- StockCharts.com
- Technical Analysis of the Financial Markets
- The Visual Investor
