HOT TOPICS LIST
- MACD
- Fibonacci
- RSI
- Gann
- ADXR
- Stochastics
- Volume
- Triangles
- Futures
- Cycles
- Volatility
- ZIGZAG
- MESA
- Retracement
- Aroon
INDICATORS LIST
LIST OF TOPICS
PRINT THIS ARTICLE
by David Penn
Some of Talbots' most dramatic price movement in the second half of 2000 has come as part of bullish gaps. But could the current price climb be one gap too many?
Position: N/A
David Penn
Technical Writer for Technical Analysis of STOCKS & COMMODITIES magazine, Working-Money.com, and Traders.com Advantage.
PRINT THIS ARTICLE
BOLLINGER BANDS
Talbots: Bollinger Band Busting
11/10/00 03:00:11 PMby David Penn
Some of Talbots' most dramatic price movement in the second half of 2000 has come as part of bullish gaps. But could the current price climb be one gap too many?
Position: N/A
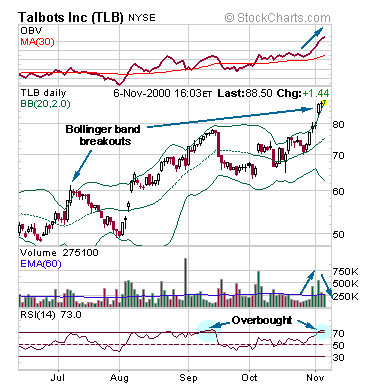
| Since July, Talbots (NYSE: TLB) has risen from about $55 per share to a high just short of $90 per share by the beginning of November. And much of this rise has occurred in fairly sudden, bullish gaps. Dropping from just above $60 to just under $50 in July, Talbots rallied in a series of upward gaps to close above $60 by early August, and continued to climb steadily to $78 by mid-September. Selling dropped shares of Talbots back to the mid-60s before gapping up to the low 70s by October and, as the month ended, gapping up further into the low 80s by November. |
| Will these frenetic, bullish gaps signify continued advances? On-balance volume, for one, has risen dramatically over its 30-day moving average in the last stages of October and into November. Even for those who do not pay much attention to moving averages on on-balance volume, OBV has also climbed above recent minor highs, suggesting that buying in Talbots has picked up significantly in recent weeks. |

|
| While on-balance volume paints a bullish picture for Talbots in early November, the relative strength index and an upside Bollinger band breakout may conspire to return TLB to lower territory. |
| Graphic provided by: StockCharts.com. |
| |
| Bollinger bands, placed two standard deviations from a 20-day moving average, contain 95% of the likely price values for the stock. Moreover, Bollinger bands tend to provide resistance at the topmost band and support at the bottom band. So it is not surprising that prices have declined when the upper band is breached--as in early July. This alone would bode somewhat bearish for Talbots in November, as prices have climbed (and remained) above the topmost Bollinger band. To add to the bearishness, the first few trading sessions in November show declining volumes. Generally speaking, rising prices on declining volumes is a sign of weakness. Paying attention to on-balance volume during this period could help confirm further weakness in TLB, should OBV trends begin to shift. |
| Certainly, if current OBV trends continue, new money could force TLB higher. However, further advances in OBV seem unlikely in the immediate term. The November incline in OBV is attributable largely to three bullish trading sessions at the beginning of the month. Unfortunately for the bulls, as noted above, the sessions were on declining volumes which suggest that even though the days were bullish, buying interest at this time and at these prices is ebbing. Compare this with the August advance, during which volume (as seen both in real and on-balance charts) increased as prices rose. |
| Lastly, the relative strength index can be helpful when prices advance toward new highs. While RSI can be misleading when dealing with stocks in sustained advances (often reading "overbought" prematurely), it can still be valuable--both as a historic indicator as well as a contemporary one. An overbought episode in early July, for example, precipitated a 16% drop in Talbot's share value, and a similar overbought reaction in September sent Talbots' shares down 10% in a single session. While Talbots' ability to climb in August without a significant overbought reaction suggested strength, the September highs did register as overbought and there was indeed a reaction. |
Technical Writer for Technical Analysis of STOCKS & COMMODITIES magazine, Working-Money.com, and Traders.com Advantage.
| Title: | Technical Writer |
| Company: | Technical Analysis, Inc. |
| Address: | 4757 California Avenue SW |
| Seattle, WA 98116 | |
| Phone # for sales: | 206 938 0570 |
| Fax: | 206 938 1307 |
| Website: | www.Traders.com |
| E-mail address: | DPenn@traders.com |
Traders' Resource Links | |
| Charting the Stock Market: The Wyckoff Method -- Books | |
| Working-Money.com -- Online Trading Services | |
| Traders.com Advantage -- Online Trading Services | |
| Technical Analysis of Stocks & Commodities -- Publications and Newsletters | |
| Working Money, at Working-Money.com -- Publications and Newsletters | |
| Traders.com Advantage -- Publications and Newsletters | |
| Professional Traders Starter Kit -- Software | |
Click here for more information about our publications!
Comments

Request Information From Our Sponsors
- VectorVest, Inc.
- Executive Premier Workshop
- One-Day Options Course
- OptionsPro
- Retirement Income Workshop
- Sure-Fire Trading Systems (VectorVest, Inc.)
- Trading as a Business Workshop
- VectorVest 7 EOD
- VectorVest 7 RealTime/IntraDay
- VectorVest AutoTester
- VectorVest Educational Services
- VectorVest OnLine
- VectorVest Options Analyzer
- VectorVest ProGraphics v6.0
- VectorVest ProTrader 7
- VectorVest RealTime Derby Tool
- VectorVest Simulator
- VectorVest Variator
- VectorVest Watchdog
- StockCharts.com, Inc.
- Candle Patterns
- Candlestick Charting Explained
- Intermarket Technical Analysis
- John Murphy on Chart Analysis
- John Murphy's Chart Pattern Recognition
- John Murphy's Market Message
- MurphyExplainsMarketAnalysis-Intermarket Analysis
- MurphyExplainsMarketAnalysis-Visual Analysis
- StockCharts.com
- Technical Analysis of the Financial Markets
- The Visual Investor
