HOT TOPICS LIST
- MACD
- Fibonacci
- RSI
- Gann
- ADXR
- Stochastics
- Volume
- Triangles
- Futures
- Cycles
- Volatility
- ZIGZAG
- MESA
- Retracement
- Aroon
INDICATORS LIST
LIST OF TOPICS
PRINT THIS ARTICLE
by David Penn
Negative divergences, engulfing candlesticks, and Fibonacci resistance conspire to send the biotechnology HOLDRS lower in mid-February.
Position: N/A
David Penn
Technical Writer for Technical Analysis of STOCKS & COMMODITIES magazine, Working-Money.com, and Traders.com Advantage.
PRINT THIS ARTICLE
REVERSAL
Biotech Comes In
02/15/07 02:37:24 PMby David Penn
Negative divergences, engulfing candlesticks, and Fibonacci resistance conspire to send the biotechnology HOLDRS lower in mid-February.
Position: N/A
| In my last Traders.com Advantage article on the short-term, hourly chart top in the NASDAQ 100 ("2B Top Meets Freaky Friday," February 12, 2007), I made a point about looking for opportunities when all of the technical stars are in alignment. Speculators can make bets on less-than-optimal setups, but the potential for surer (and often larger) gains is always greater when a number of technical clues — from candlestick patterns to indicators to volume — all seem to be suggesting the same thing. |

|
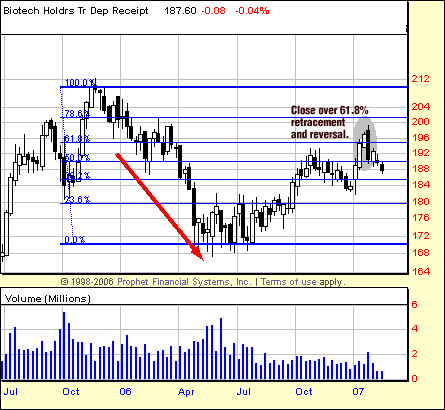
| BIOTECHNOLOGY HOLDRS, WEEKLY. After its fall 2005 to summer 2006 decline, BBH managed to close above a Fibonacci 61.8% retracement. The weekly reversal that followed immediately afterward in the form of a bearish engulfing candlestick was a clear sign that upside progress would be limited in the short-to-intermediate term. |
| Graphic provided by: Prophet Financial, Inc. |
| |
| Just such an alignment seems to be developing in the weekly chart of the biotechnology HOLDRS (BBH) (Figure 1). I've written about biotechnology a few times recently — from my Working-Money.com "Sector Spotting" piece from the summer of 2006 ("Betting On Biotech") to my update in Traders.com Advantage from January of this year ("The Biotech Bet Is Back"). Both pieces were timely in their bullishness on biotechnology in both the intermediate term and the short term. This article focuses on some of the more bearish signs that have appeared on the weekly chart and looks for clues as to whether the current correction in biotech (as measured by the BBH) will grow into a major reversal or simply another buying opportunity. The weekly chart in Figure 1 shows the top in BBH from the autumn of 2005, the bottom in the summer of 2006, and the rally since. Two things stand out to me. The first is the massive engulfing candlestick in mid- to late January. The fact that this candlestick develops with volume not seen since early August 2006 makes the bearishness of that engulfing pattern all the more worth minding. Sure enough, the BBH has made lower weekly closing lows in the weeks since that engulfing candlestick appeared. |
| The other interesting observation is how the BBH moved after breaching the 61.8% retracement level as shown by the Fibonacci retracements. While it is true that resistance often acts as a sort of brick wall against which prices haplessly fling themselves, it is also true that resistance can be somewhat pliable, often tricking traders into believing that a breach has occurred only to have a lack of follow-through or, as perhaps an example of the ultimate "lack of follow-through," simply reversing outright. |

|
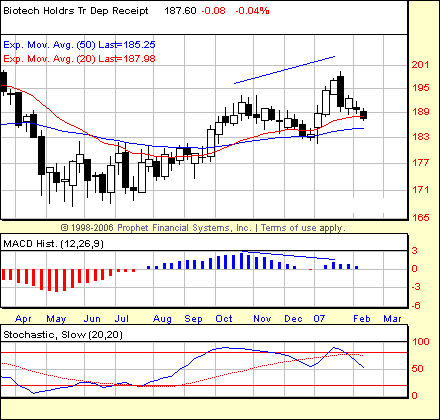
| BIOTECHNOLOGY HOLDRS, WEEKLY. The negative divergence in the MACD histogram is another sign that BBH is likely to move lower before it moves significantly higher. There is much support between its current level and the late January 2007 pivot low just south of 183. Failing that, the consolidation between 177 and 171 would likely stem any extended decline. |
| Graphic provided by: Prophet Financial, Inc. |
| |
| BBH definitely did the latter in late January as the HOLDRS rallied above 61.8% on a weekly closing basis, only to collapse back below that level with the following weekly close — as well as on sizable volume. Technical indicators also helped tip off speculators that BBH's rising tide was set to ebb. In particular, the MACD histogram shown in the weekly chart in Figure 2 reveals a distinct negative divergence between the peaks in the autumn of 2006 and the peak in January 2007. While not necessarily a short signal, a negative divergence on a weekly chart can anticipate an extended period of sideways movement as well as something more sharply to the downside. The message for long-side traders, however, is clear: Be wary of biotech here. |
| There is support that any decline in BBH will have to test. Most immediately, this potential support comes in the form of the 20- and 50-week exponential moving averages at approximately 185 and 188. Right below this support is an upward trendline that extends from the summer of 2006 lows. And below this is the spring and summer consolidation range of 2006, which looks to provide a floor at the 170 level. Back in 2005, BBH slipped into a correction in the early spring and came roaring back — rallying from a correction low around 131 in early March to about 210 in November. Whether BBH will undergo a similar first-quarter correction en route to a similarly spectacular advance is anyone's guess. But there appears to be an abundance of the sort of support that should make any correction over the next few weeks a relatively mild one, and make the potential for a significant rally afterward something better than an even-money bet. |
Technical Writer for Technical Analysis of STOCKS & COMMODITIES magazine, Working-Money.com, and Traders.com Advantage.
| Title: | Technical Writer |
| Company: | Technical Analysis, Inc. |
| Address: | 4757 California Avenue SW |
| Seattle, WA 98116 | |
| Phone # for sales: | 206 938 0570 |
| Fax: | 206 938 1307 |
| Website: | www.Traders.com |
| E-mail address: | DPenn@traders.com |
Traders' Resource Links | |
| Charting the Stock Market: The Wyckoff Method -- Books | |
| Working-Money.com -- Online Trading Services | |
| Traders.com Advantage -- Online Trading Services | |
| Technical Analysis of Stocks & Commodities -- Publications and Newsletters | |
| Working Money, at Working-Money.com -- Publications and Newsletters | |
| Traders.com Advantage -- Publications and Newsletters | |
| Professional Traders Starter Kit -- Software | |
Click here for more information about our publications!
Comments
Date: 02/15/07Rank: 3Comment:

Request Information From Our Sponsors
- StockCharts.com, Inc.
- Candle Patterns
- Candlestick Charting Explained
- Intermarket Technical Analysis
- John Murphy on Chart Analysis
- John Murphy's Chart Pattern Recognition
- John Murphy's Market Message
- MurphyExplainsMarketAnalysis-Intermarket Analysis
- MurphyExplainsMarketAnalysis-Visual Analysis
- StockCharts.com
- Technical Analysis of the Financial Markets
- The Visual Investor
- VectorVest, Inc.
- Executive Premier Workshop
- One-Day Options Course
- OptionsPro
- Retirement Income Workshop
- Sure-Fire Trading Systems (VectorVest, Inc.)
- Trading as a Business Workshop
- VectorVest 7 EOD
- VectorVest 7 RealTime/IntraDay
- VectorVest AutoTester
- VectorVest Educational Services
- VectorVest OnLine
- VectorVest Options Analyzer
- VectorVest ProGraphics v6.0
- VectorVest ProTrader 7
- VectorVest RealTime Derby Tool
- VectorVest Simulator
- VectorVest Variator
- VectorVest Watchdog
