HOT TOPICS LIST
- MACD
- Fibonacci
- RSI
- Gann
- ADXR
- Stochastics
- Volume
- Triangles
- Futures
- Cycles
- Volatility
- ZIGZAG
- MESA
- Retracement
- Aroon
INDICATORS LIST
LIST OF TOPICS
PRINT THIS ARTICLE
by Arthur Hill
The recent rally in the Oil Services Index ($OSX) looks like a corrective advance, and a breakdown from here would call for a measured move lower.
Position: Hold
Arthur Hill
Arthur Hill is currently editor of TDTrader.com, a website specializing in trading strategies, sector/industry specific breadth stats and overall technical analysis. He passed the Society of Technical Analysts (STA London) diploma exam with distinction is a Certified Financial Technician (CFTe). Prior to TD Trader, he was the Chief Technical Analyst for Stockcharts.com and the main contributor to the ChartSchool.
PRINT THIS ARTICLE
STOCHASTIC OSCILL
OSX Looks Ripe For A Measured Move
02/15/07 02:28:51 PMby Arthur Hill
The recent rally in the Oil Services Index ($OSX) looks like a corrective advance, and a breakdown from here would call for a measured move lower.
Position: Hold
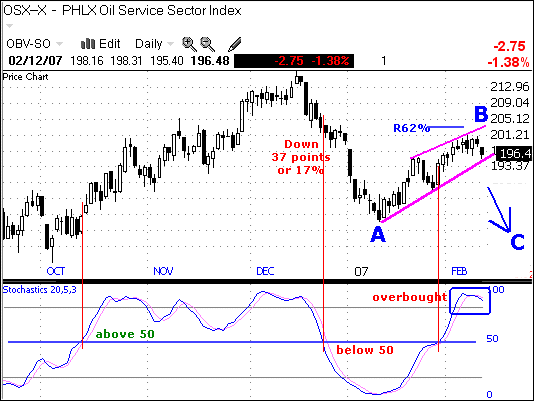
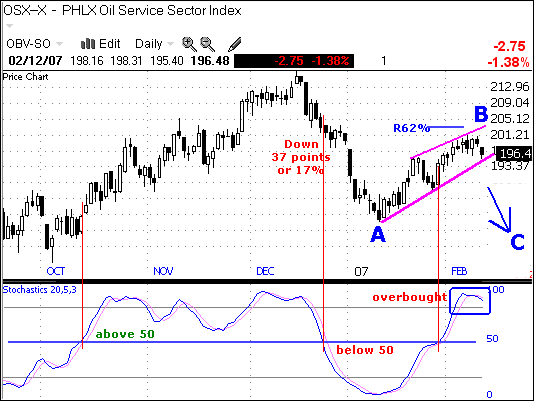
| On the daily chart (Figure 1), the Oil Services Index ($OSX) declined sharply from mid-December to mid-January and then rallied over the last five weeks. The rally retraced 50–62% of that decline and formed a rising wedge. Both the retracement and the pattern are typical for corrective advances. Most recently, the stock stalled over the last five days, and traders should be on guard for a continuation lower. |

|
| Graphic provided by: Telechart 2007. |
| |
| Two things will signal a continuation lower. First, OSX needs to break the lower trendline of the rising wedge. As long as this trendline holds, the wedge is still rising and it is premature to count on a reversal. Second, look for the stochastic oscillator to move below 50. This centerline separates bullish momentum with bearish momentum. The bulls have the edge when the stochastic oscillator is above 50 and the bears have the edge when it is below 50 (Figure 2). The red vertical lines show the last three crossovers. |

|
| |
| A breakdown from current levels would signal a continuation of the December–January decline. We can then use the measured move technique to find a target. The first decline was 37 points, or 17%. I prefer percentages and would look for another 17% decline from the February high. This would target a move to around 167. We can also employ a little Elliott wave and consider the current advance as wave B of a potential ABC decline. A wave C continuation would be expected to equal wave A. |
Arthur Hill is currently editor of TDTrader.com, a website specializing in trading strategies, sector/industry specific breadth stats and overall technical analysis. He passed the Society of Technical Analysts (STA London) diploma exam with distinction is a Certified Financial Technician (CFTe). Prior to TD Trader, he was the Chief Technical Analyst for Stockcharts.com and the main contributor to the ChartSchool.
| Title: | Editor |
| Company: | TDTrader.com |
| Address: | Willem Geetsstraat 17 |
| Mechelen, B2800 | |
| Phone # for sales: | 3215345465 |
| Website: | www.tdtrader.com |
| E-mail address: | arthurh@tdtrader.com |
Traders' Resource Links | |
| TDTrader.com has not added any product or service information to TRADERS' RESOURCE. | |
Click here for more information about our publications!
Comments
Date: 02/15/07Rank: 4Comment:

Request Information From Our Sponsors
- StockCharts.com, Inc.
- Candle Patterns
- Candlestick Charting Explained
- Intermarket Technical Analysis
- John Murphy on Chart Analysis
- John Murphy's Chart Pattern Recognition
- John Murphy's Market Message
- MurphyExplainsMarketAnalysis-Intermarket Analysis
- MurphyExplainsMarketAnalysis-Visual Analysis
- StockCharts.com
- Technical Analysis of the Financial Markets
- The Visual Investor
- VectorVest, Inc.
- Executive Premier Workshop
- One-Day Options Course
- OptionsPro
- Retirement Income Workshop
- Sure-Fire Trading Systems (VectorVest, Inc.)
- Trading as a Business Workshop
- VectorVest 7 EOD
- VectorVest 7 RealTime/IntraDay
- VectorVest AutoTester
- VectorVest Educational Services
- VectorVest OnLine
- VectorVest Options Analyzer
- VectorVest ProGraphics v6.0
- VectorVest ProTrader 7
- VectorVest RealTime Derby Tool
- VectorVest Simulator
- VectorVest Variator
- VectorVest Watchdog
