HOT TOPICS LIST
- MACD
- Fibonacci
- RSI
- Gann
- ADXR
- Stochastics
- Volume
- Triangles
- Futures
- Cycles
- Volatility
- ZIGZAG
- MESA
- Retracement
- Aroon
INDICATORS LIST
LIST OF TOPICS
PRINT THIS ARTICLE
by Chaitali Mohile
A breakaway gap from a particular pattern reinforces the gap and the continuation of trend. FEI Co. is heading toward the target of $41.
Position: Buy
Chaitali Mohile
Active trader in the Indian stock markets since 2003 and a full-time writer. Trading is largely based upon technical analysis.
PRINT THIS ARTICLE
GAPS
FEIC Gives Gap Breakout Of Falling Wedge
02/22/07 01:53:03 PMby Chaitali Mohile
A breakaway gap from a particular pattern reinforces the gap and the continuation of trend. FEI Co. is heading toward the target of $41.
Position: Buy
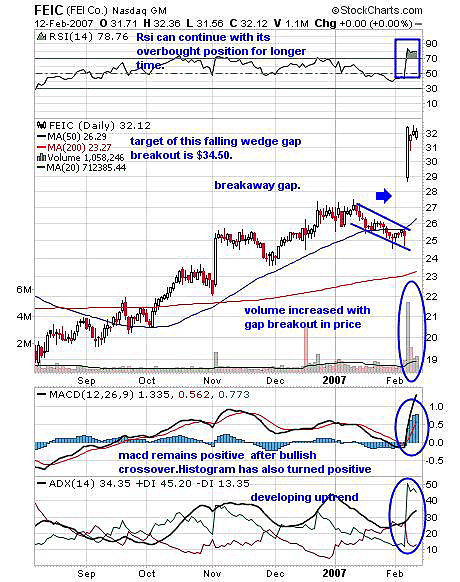
| FEI Co. (FEIC) has given a gap breakout from a falling wedge. A falling wedge is a bullish pattern and its breakout is always upward. The usual style to trade the gaps is on consolidation, or by filling the gap. But a breakaway gap with heavy volume cannot get filled faster, so it can be bought at the upper level of breakout. In Figure 1, the relative strength index (RSI) (14) became overbought on a huge gap breakout. The volume maintaining marginally above average is also important, though it needs to increase. The moving average convergence/divergence (MACD) (12,26,9) has given a bullish crossover with great strength and remained positive then after. The average directional movement index (ADX)(14) is above 30, indicating developing a bullish trend. |
| Now, to trade this breakout, traders can buy above $32 with a target of $34.50. This target is calculated with the length of a falling wedge -- $2.50 ($25.50 - $27.50). |
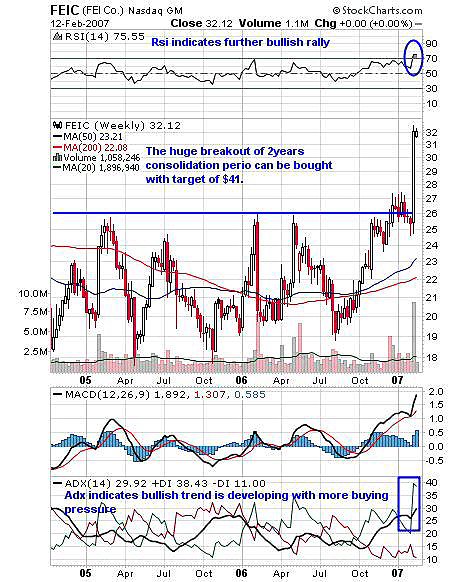
| In Figure 2, FEIC can be seen seen breaking out of its long congestion period. The stock was consolidated for almost two years. The breakout above the range will signify the developing performance of the stock. As the price moved above $27, a dramatic increase in volume is seen. This strengthens the breakout move. As the stock moves out of its long consolidation phase, it should be bought. The RSI (14) has steeply moved to 75 with the drastic change in price. This indicator can remain overbought for a longer period so traders need not worry about decline. The ADX (14) also indicates the developing trend. Traders can thus take this positive sign for positioning themselves on the long side of the trend. |

|
| FIGURE 1: FEIC, DAILY. Breakaway gap from a falling wedge. |
| Graphic provided by: StockCharts.com. |
| |
| The MACD (12,26,9) is equally positive to consider. Here, I would like to give a target of $41. The length of a congestion period is calculated and added to the upper level of a breakout. So by adding $9 ($18-$27) to $32, we get the target of $41. Accordingly, this target looks achievable. |

|
| FIGURE 2: FEIC, WEEKLY. FEIC moves out of a long consolidation period. Next, the target on breakout is $41. |
| Graphic provided by: StockCharts.com. |
| |
| To conclude, the breakaway gap -- particularly from any pattern -- can be bought. And the breakout on heavy volume adds strength. |
Active trader in the Indian stock markets since 2003 and a full-time writer. Trading is largely based upon technical analysis.
| Company: | Independent |
| Address: | C1/3 Parth Indraprasth Towers. Vastrapur |
| Ahmedabad, Guj 380015 | |
| E-mail address: | chaitalimohile@yahoo.co.in |
Traders' Resource Links | |
| Independent has not added any product or service information to TRADERS' RESOURCE. | |
Click here for more information about our publications!
Comments
Date: 02/22/07Rank: 4Comment:

Request Information From Our Sponsors
- StockCharts.com, Inc.
- Candle Patterns
- Candlestick Charting Explained
- Intermarket Technical Analysis
- John Murphy on Chart Analysis
- John Murphy's Chart Pattern Recognition
- John Murphy's Market Message
- MurphyExplainsMarketAnalysis-Intermarket Analysis
- MurphyExplainsMarketAnalysis-Visual Analysis
- StockCharts.com
- Technical Analysis of the Financial Markets
- The Visual Investor
- VectorVest, Inc.
- Executive Premier Workshop
- One-Day Options Course
- OptionsPro
- Retirement Income Workshop
- Sure-Fire Trading Systems (VectorVest, Inc.)
- Trading as a Business Workshop
- VectorVest 7 EOD
- VectorVest 7 RealTime/IntraDay
- VectorVest AutoTester
- VectorVest Educational Services
- VectorVest OnLine
- VectorVest Options Analyzer
- VectorVest ProGraphics v6.0
- VectorVest ProTrader 7
- VectorVest RealTime Derby Tool
- VectorVest Simulator
- VectorVest Variator
- VectorVest Watchdog
