HOT TOPICS LIST
- MACD
- Fibonacci
- RSI
- Gann
- ADXR
- Stochastics
- Volume
- Triangles
- Futures
- Cycles
- Volatility
- ZIGZAG
- MESA
- Retracement
- Aroon
INDICATORS LIST
LIST OF TOPICS
PRINT THIS ARTICLE
by David Penn
Would Friday be a bullish or bearish event? Early on, the markets tipped traders off to the bear.
Position: N/A
David Penn
Technical Writer for Technical Analysis of STOCKS & COMMODITIES magazine, Working-Money.com, and Traders.com Advantage.
PRINT THIS ARTICLE
REVERSAL
2B Top Meets Freaky Friday
02/12/07 01:30:39 PMby David Penn
Would Friday be a bullish or bearish event? Early on, the markets tipped traders off to the bear.
Position: N/A
| I recently wrote an article for Working-Money.com that looked at ways that traders could game the downside of 2B tops ("Breakouts, Pullbacks, And Gaming The 2B," January 24). It was a trading rule in the same spirit of many money management rules that was geared toward putting a sort of "time stop" on 2B trades. In short, the rule was this: Half the time it took for the top to develop is a reasonable amount of time to expect the breakdown to reach a profitable destination. |

|
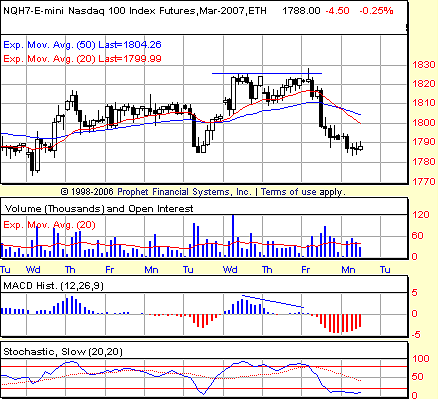
| FIGURE 1: NASDAQ 100 EMINI, MARCH FUTURES, HOURLY. A shooting star candlestick and negative divergences in both the moving average convergence/divergence (MACD) histogram and stochastic help explain why the selling was so swift after the failed higher high. This was a picture-perfect prelude to a reversal. |
| Graphic provided by: Prophet Financial, Inc. |
| |
| In other words, if you have 10 sessions between peaks in a 2B top ("sessions" could be trading days or trading hours), then look to take profits or otherwise lock in gains by or before the fifth session after the breakdown. This is not to say that the market in question won't continue to fall. Rather, it is a precaution against staying too long after a failed new high. Even if the market is to move lower, markets often have sharp bounces after initial breakdowns, and getting caught short during those bounces can easily whip a trader out of an otherwise-profitable position. |
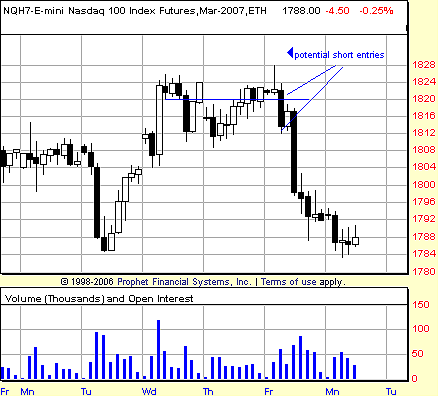
| The recent breakdown in the NASDAQ 100 gives us another opportunity to see this at work. The NASDAQ 100 made a new high in the fourth hour of trading on Wednesday, February 7. The market pulled back mildly over the balance of Wednesday and throughout Thursday. On Friday morning, the market opened up and set a new intrahour high, but then immediately began selling off. Trader alerts to the possibility of 2B tops would have been able to go short an hour later when the market moved below the low of the original, "new-high" session from the previous Wednesday. |

|
| FIGURE 2: NASDAQ 100 EMINI, MARCH FUTURES, HOURLY. Whether or not a trader wanted to jump as soon as the low of the initial high was breached or waited for that breach to be confirmed on a closing basis, both short entries provided excellent end-of-the-week gains by the end of expiration Friday. |
| Graphic provided by: Prophet Financial, Inc. |
| |
| The March NASDAQ 100 emini futures contract in Figure 1 shows the 2B top that ended the week. Note the initial high and then the higher high that develops two days later. There are a number of beautiful tells in the chart — from the shooting star candlestick that marks the higher high to the negative divergences in both the MACD histogram and the stochastic. There are plenty of times when signs are misread, or when signs don't turn out as planned. But more often than not, when the technical signs start to become this well aligned, the expected outcome is often soon to follow. |
| How about our measuring rule? The span between the two peaks is about 15 trading sessions (each session in the chart is one hour). That suggests that about seven or eight sessions after the entry, traders should be looking to take profits based on shorting the 2B breakdown. The market reversed swiftly after the shooting star, and traders trading the 2B top were able to launch positions almost immediately when the low of the initial high, 1820, was taken out. More cautious traders may prefer to see this happen on a closing basis. In any event, by the end of the 9:00–10:00 am hour on Friday morning, traders should have been short. For counting purposes, we'll use the worst fill of 1813. The market closed after the sixth trading session following the entry. At this point, daytraders would have to have taken profits. But with a close at 1791.75, it is likely that they went home happy, having picked up some 21-odd points (at $20 per point) over the course of a few hours. Holding out for the seventh or eighth trading session on Monday might have earned traders an additional five-odd points. |
Technical Writer for Technical Analysis of STOCKS & COMMODITIES magazine, Working-Money.com, and Traders.com Advantage.
| Title: | Technical Writer |
| Company: | Technical Analysis, Inc. |
| Address: | 4757 California Avenue SW |
| Seattle, WA 98116 | |
| Phone # for sales: | 206 938 0570 |
| Fax: | 206 938 1307 |
| Website: | www.Traders.com |
| E-mail address: | DPenn@traders.com |
Traders' Resource Links | |
| Charting the Stock Market: The Wyckoff Method -- Books | |
| Working-Money.com -- Online Trading Services | |
| Traders.com Advantage -- Online Trading Services | |
| Technical Analysis of Stocks & Commodities -- Publications and Newsletters | |
| Working Money, at Working-Money.com -- Publications and Newsletters | |
| Traders.com Advantage -- Publications and Newsletters | |
| Professional Traders Starter Kit -- Software | |
Click here for more information about our publications!
Comments
Date: 02/12/07Rank: 3Comment:

Request Information From Our Sponsors
- StockCharts.com, Inc.
- Candle Patterns
- Candlestick Charting Explained
- Intermarket Technical Analysis
- John Murphy on Chart Analysis
- John Murphy's Chart Pattern Recognition
- John Murphy's Market Message
- MurphyExplainsMarketAnalysis-Intermarket Analysis
- MurphyExplainsMarketAnalysis-Visual Analysis
- StockCharts.com
- Technical Analysis of the Financial Markets
- The Visual Investor
- VectorVest, Inc.
- Executive Premier Workshop
- One-Day Options Course
- OptionsPro
- Retirement Income Workshop
- Sure-Fire Trading Systems (VectorVest, Inc.)
- Trading as a Business Workshop
- VectorVest 7 EOD
- VectorVest 7 RealTime/IntraDay
- VectorVest AutoTester
- VectorVest Educational Services
- VectorVest OnLine
- VectorVest Options Analyzer
- VectorVest ProGraphics v6.0
- VectorVest ProTrader 7
- VectorVest RealTime Derby Tool
- VectorVest Simulator
- VectorVest Variator
- VectorVest Watchdog
