HOT TOPICS LIST
- MACD
- Fibonacci
- RSI
- Gann
- ADXR
- Stochastics
- Volume
- Triangles
- Futures
- Cycles
- Volatility
- ZIGZAG
- MESA
- Retracement
- Aroon
INDICATORS LIST
LIST OF TOPICS
PRINT THIS ARTICLE
by Koos van der Merwe
Uranium Participation is an investment holding company that invests substantially all of its assets in uranium.
Position: Hold
Koos van der Merwe
Has been a technical analyst since 1969, and has worked as a futures and options trader with First Financial Futures in Johannesburg, South Africa.
PRINT THIS ARTICLE
TRIANGLES
Uranium Participation
02/12/07 09:23:56 AMby Koos van der Merwe
Uranium Participation is an investment holding company that invests substantially all of its assets in uranium.
Position: Hold
| The objective of the Uranium Participation Corp. is to provide an investment alternative for investors interested in holding uranium. Securities are listed and trade on the Toronto Stock Exchange and a net asset value is calculated and reported monthly. |

|
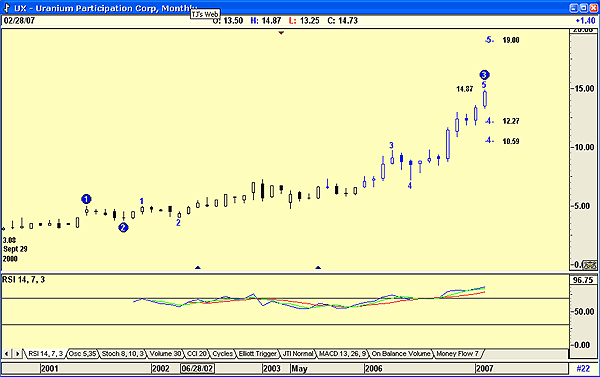
| FIGURE 1: URANIUM PARTICIPATION CORP., MONTHLY. Uranium Participation shows an Elliott wave formation. |
| Graphic provided by: AdvancedGET. |
| |
| Figure 1, a monthly chart, and shows how the price moved from a low of $3.08 on September 29, 2000, to the present high of $14.87. The chart also suggests an Elliott wave account with a wave 3 completed and a wave 4 suggesting targets of 12.27 and 10.59. The relative strength index (RSI) is overbought but has not given a sell signal, so we could expect a further upside movement or a sideways movement until a more definite signal is given on a monthly scale. To resolve this, we turn to Figure 2, a weekly chart. |

|
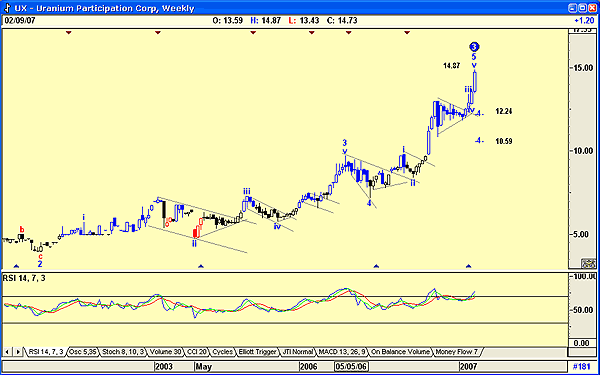
| FIGURE 2: URANIUM PARTICIPATION CORP., WEEKLY. Uranium Participation shows triangular consolidation patterns and breakout levels. |
| Graphic provided by: AdvancedGET. |
| |
| Figure 2 shows how the price rose on up bursts following a consolidation triangle or flag pattern. The present high suggests that one is due now. Once again the RSI is overbought, with a sell signal not given. |

|
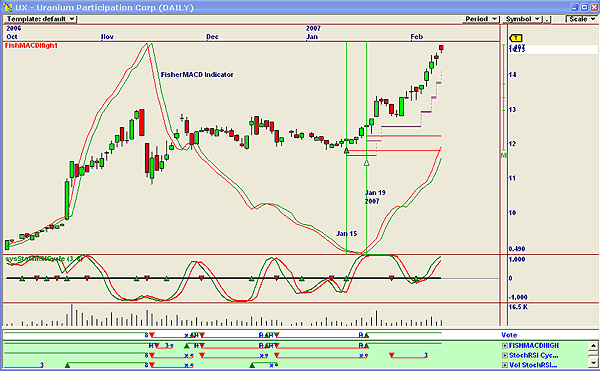
| FIGURE 3: URANIUM PARTICIPATION, DAILY. This OmniTrrader chart shows buy and sell signals, with the present indicator being a buy and hold. |
| Graphic provided by: Omnitrader. |
| |
| Finally, Figure 3, a daily chart, gave an RSI/stochastics buy signal on January 15, reinforced on January 19 by a Fisher moving average convergence/divergence (MACD) signal. No sell signal has been given and both indicators are positive. |
| Figure 3 suggests that if you are a holder of Uranium Participation, then continue to hold using a stop-loss signal to close the position. Should you wish to purchase the stock, weekly and monthly charts suggest that you wait for a price correction before buying. |
Has been a technical analyst since 1969, and has worked as a futures and options trader with First Financial Futures in Johannesburg, South Africa.
| Address: | 3256 West 24th Ave |
| Vancouver, BC | |
| Phone # for sales: | 6042634214 |
| E-mail address: | petroosp@gmail.com |
Click here for more information about our publications!
Comments
Date: 02/12/07Rank: 2Comment:

Request Information From Our Sponsors
- StockCharts.com, Inc.
- Candle Patterns
- Candlestick Charting Explained
- Intermarket Technical Analysis
- John Murphy on Chart Analysis
- John Murphy's Chart Pattern Recognition
- John Murphy's Market Message
- MurphyExplainsMarketAnalysis-Intermarket Analysis
- MurphyExplainsMarketAnalysis-Visual Analysis
- StockCharts.com
- Technical Analysis of the Financial Markets
- The Visual Investor
- VectorVest, Inc.
- Executive Premier Workshop
- One-Day Options Course
- OptionsPro
- Retirement Income Workshop
- Sure-Fire Trading Systems (VectorVest, Inc.)
- Trading as a Business Workshop
- VectorVest 7 EOD
- VectorVest 7 RealTime/IntraDay
- VectorVest AutoTester
- VectorVest Educational Services
- VectorVest OnLine
- VectorVest Options Analyzer
- VectorVest ProGraphics v6.0
- VectorVest ProTrader 7
- VectorVest RealTime Derby Tool
- VectorVest Simulator
- VectorVest Variator
- VectorVest Watchdog
