

HOT TOPICS LIST
- MACD
- Fibonacci
- RSI
- Gann
- ADXR
- Stochastics
- Volume
- Triangles
- Futures
- Cycles
- Volatility
- ZIGZAG
- MESA
- Retracement
- Aroon
INDICATORS LIST
LIST OF TOPICS
PRINT THIS ARTICLE
by Arthur Hill
The Amex Gold Bugs Index has been range-bound the last 12 months, but the swings within this range offer a way to play and anticipate a bigger breakout.
Position: Accumulate
Arthur Hill
Arthur Hill is currently editor of TDTrader.com, a website specializing in trading strategies, sector/industry specific breadth stats and overall technical analysis. He passed the Society of Technical Analysts (STA London) diploma exam with distinction is a Certified Financial Technician (CFTe). Prior to TD Trader, he was the Chief Technical Analyst for Stockcharts.com and the main contributor to the ChartSchool.
PRINT THIS ARTICLE
SWING CHART
Playing The Gold Bug Swings
02/08/07 08:43:33 AMby Arthur Hill
The Amex Gold Bugs Index has been range-bound the last 12 months, but the swings within this range offer a way to play and anticipate a bigger breakout.
Position: Accumulate
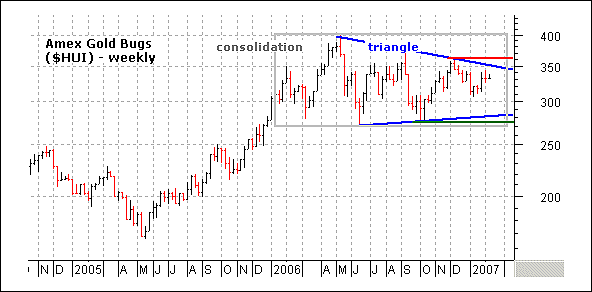
| Before looking at the swings, let's start with the weekly chart for an overall perspective (Figure 1). The Amex Gold Bugs Index ($HUI) surged from May 2005 to May 2006 and more than doubled in the process. It was a huge move and some sort of consolidation was in order. As a result, the index traded flat from January 2006 to the present and a triangle has taken shape over the last nine months. A break above the upper trendline and December high (362.53) would signal a continuation higher. A break below the lower trendline and October low would forge a reversal lower. |
|
| FIGURE 1: $HUI, WEEKLY. The index surged from May 2005 to May 2006 and more than doubled in the process. |
| Graphic provided by: MetaStock. |
| |
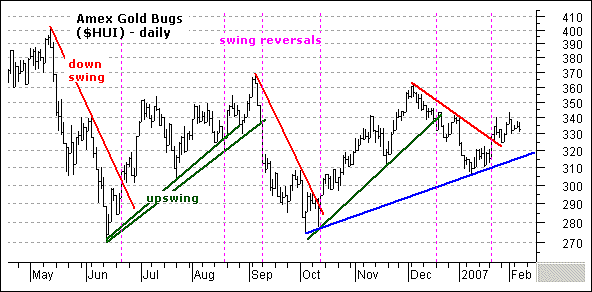
| Turning to the daily chart (Figure 2), we can see the swings within this triangle. The red lines show the downswings and the green lines show the upswings. The dotted magenta lines correspond to trendline breaks. The breaks provided pretty good signals, with one bad signal in mid-August. The last downswing occurred in December 2006–January 2007 and the late January breakout started the latest upswing. This signal remains in effect and I expect higher prices as long as the breakout holds. The first target is resistance around 360–370. |
|
| FIGURE 2: $HUI, DAILY. The red lines show the downswings and the green lines show the upswings. |
| Graphic provided by: MetaStock. |
| |
| The December–January downswing was shorter than the prior four swings, and this tells me that the range is narrowing. The higher lows and lower highs fit with the formation of a triangle on the weekly chart as well. Because of the narrowing triangle, I would also be alert for a short upswing here. It is too early to draw a trendline extending up from the January low, so I have opted for a trendline extending up from the October low (blue). This now defines the current upswing. A break move below 315 would break this trendline and call for a downswing. |
Arthur Hill is currently editor of TDTrader.com, a website specializing in trading strategies, sector/industry specific breadth stats and overall technical analysis. He passed the Society of Technical Analysts (STA London) diploma exam with distinction is a Certified Financial Technician (CFTe). Prior to TD Trader, he was the Chief Technical Analyst for Stockcharts.com and the main contributor to the ChartSchool.
| Title: | Editor |
| Company: | TDTrader.com |
| Address: | Willem Geetsstraat 17 |
| Mechelen, B2800 | |
| Phone # for sales: | 3215345465 |
| Website: | www.tdtrader.com |
| E-mail address: | arthurh@tdtrader.com |
Traders' Resource Links | |
| TDTrader.com has not added any product or service information to TRADERS' RESOURCE. | |
Click here for more information about our publications!
Comments
Date:�02/09/07Rank:�4Comment:�
Date:�02/11/07Rank:�4Comment:�

Request Information From Our Sponsors
- StockCharts.com, Inc.
- Candle Patterns
- Candlestick Charting Explained
- Intermarket Technical Analysis
- John Murphy on Chart Analysis
- John Murphy's Chart Pattern Recognition
- John Murphy's Market Message
- MurphyExplainsMarketAnalysis-Intermarket Analysis
- MurphyExplainsMarketAnalysis-Visual Analysis
- StockCharts.com
- Technical Analysis of the Financial Markets
- The Visual Investor
- VectorVest, Inc.
- Executive Premier Workshop
- One-Day Options Course
- OptionsPro
- Retirement Income Workshop
- Sure-Fire Trading Systems (VectorVest, Inc.)
- Trading as a Business Workshop
- VectorVest 7 EOD
- VectorVest 7 RealTime/IntraDay
- VectorVest AutoTester
- VectorVest Educational Services
- VectorVest OnLine
- VectorVest Options Analyzer
- VectorVest ProGraphics v6.0
- VectorVest ProTrader 7
- VectorVest RealTime Derby Tool
- VectorVest Simulator
- VectorVest Variator
- VectorVest Watchdog