HOT TOPICS LIST
- MACD
- Fibonacci
- RSI
- Gann
- ADXR
- Stochastics
- Volume
- Triangles
- Futures
- Cycles
- Volatility
- ZIGZAG
- MESA
- Retracement
- Aroon
INDICATORS LIST
LIST OF TOPICS
PRINT THIS ARTICLE
by Chaitali Mohile
Acadia Reality Trust is surging upward. What can we expect as a target?
Position: Buy
Chaitali Mohile
Active trader in the Indian stock markets since 2003 and a full-time writer. Trading is largely based upon technical analysis.
PRINT THIS ARTICLE
BREAKOUTS
Acadia Reality Trust Remains Strong
02/09/07 02:51:29 PMby Chaitali Mohile
Acadia Reality Trust is surging upward. What can we expect as a target?
Position: Buy
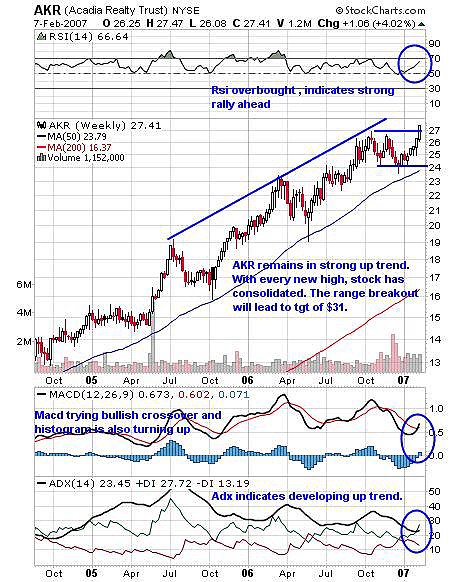
| The stock that consolidates and continues its previous rally is considered strong, and Acadia Reality Trust (AKR) can be found under that category. AKR has surged upward after consolidating with a new high made on the weekly chart. In Figure 1 the stock can be seen moving in the direction of the 50-day moving average (MA). The stock made a fresh move after consolidation with the support of 50-day MA. The price can be seen moving in the range of $24-$27 for last three months, conserving its strength for the next trip up. As a consequence, any breakout above 27 will give fresh buying. The relative strength index (RSI)(14) has just turned overbought, indicating the rally can move further with excellent bullish strength. Though the average directional movement index (ADX)(14) has declined from 30, that does not indicate any danger to the stock's main trend. In fact, more buying pressure can be seen as +DI (directional index) moves above ADX, indicating a developing uptrend. The moving average convergence/divergence histogram (MACDH) (12,26,9) is also trying to cross its trigger line (9), giving a bullish crossover and the histogram has moved above its zero line. |
| Traders should remember that trading range-bound markets can be risky, so though the RSI gave a buy signal at $24, it shouldn't be bought; hence, traders can buy at the current level with a target of $31. Further, $4 ($24-$27) is added to $27 (the breakout level) to calculate above the target. |

|
| FIGURE 1: AKR, WEEKLY. The stock consolidates in a range of $24–$27. |
| Graphic provided by: StockCharts.com. |
| |
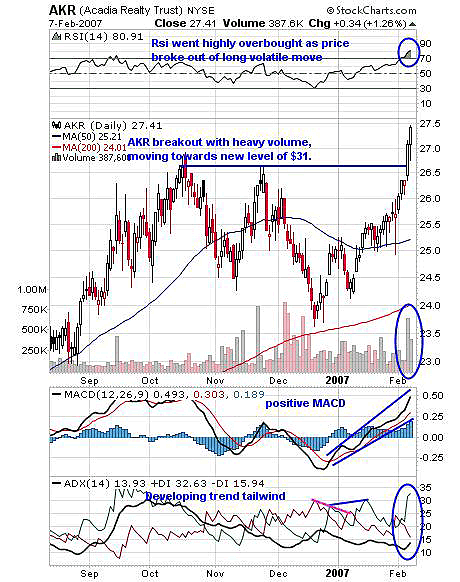
| The daily chart (Figure 2) shows a zigzag move before a breakout. The MACD (12,26,9) gave a bullish crossover and has been positive since the price made higher lows at $23.5 and $24. The RSI (14) suddenly went highly overbought with a price breakout at $26.5, indicating positive strength in breakout. The RSI can stay overbought further too. Meanwhile, the ADX (14) moves above 10, indicating developing a trend tailwind. The price declined twice from its previous high pivot, the ADX showing more selling pressure previously. But as price made higher lows, the buyer pressure increased, indicating a developing uptrend. Thus, the chart confirms fresh buy opportunities on this breakout above $27, with target of $31. |

|
| FIGURE 2: AKR, DAILY. The previous high was violated with heavy volume. |
| Graphic provided by: StockCharts.com. |
| |
| The stock that consolidates between upward rallies can be bought, but the range breakout with heavy volume is necessary. |
Active trader in the Indian stock markets since 2003 and a full-time writer. Trading is largely based upon technical analysis.
| Company: | Independent |
| Address: | C1/3 Parth Indraprasth Towers. Vastrapur |
| Ahmedabad, Guj 380015 | |
| E-mail address: | chaitalimohile@yahoo.co.in |
Traders' Resource Links | |
| Independent has not added any product or service information to TRADERS' RESOURCE. | |
Click here for more information about our publications!
Comments
Date: 02/09/07Rank: 5Comment:
Date: 02/11/07Rank: 5Comment:

Request Information From Our Sponsors
- VectorVest, Inc.
- Executive Premier Workshop
- One-Day Options Course
- OptionsPro
- Retirement Income Workshop
- Sure-Fire Trading Systems (VectorVest, Inc.)
- Trading as a Business Workshop
- VectorVest 7 EOD
- VectorVest 7 RealTime/IntraDay
- VectorVest AutoTester
- VectorVest Educational Services
- VectorVest OnLine
- VectorVest Options Analyzer
- VectorVest ProGraphics v6.0
- VectorVest ProTrader 7
- VectorVest RealTime Derby Tool
- VectorVest Simulator
- VectorVest Variator
- VectorVest Watchdog
- StockCharts.com, Inc.
- Candle Patterns
- Candlestick Charting Explained
- Intermarket Technical Analysis
- John Murphy on Chart Analysis
- John Murphy's Chart Pattern Recognition
- John Murphy's Market Message
- MurphyExplainsMarketAnalysis-Intermarket Analysis
- MurphyExplainsMarketAnalysis-Visual Analysis
- StockCharts.com
- Technical Analysis of the Financial Markets
- The Visual Investor
