HOT TOPICS LIST
- MACD
- Fibonacci
- RSI
- Gann
- ADXR
- Stochastics
- Volume
- Triangles
- Futures
- Cycles
- Volatility
- ZIGZAG
- MESA
- Retracement
- Aroon
INDICATORS LIST
LIST OF TOPICS
PRINT THIS ARTICLE
by Chaitali Mohile
PCAR is likely to dip temporarily, according to RSI and ADX.
Position: N/A
Chaitali Mohile
Active trader in the Indian stock markets since 2003 and a full-time writer. Trading is largely based upon technical analysis.
PRINT THIS ARTICLE
ADXR
Paccar Inc. Likely To Retrace?
02/07/07 03:03:42 PMby Chaitali Mohile
PCAR is likely to dip temporarily, according to RSI and ADX.
Position: N/A
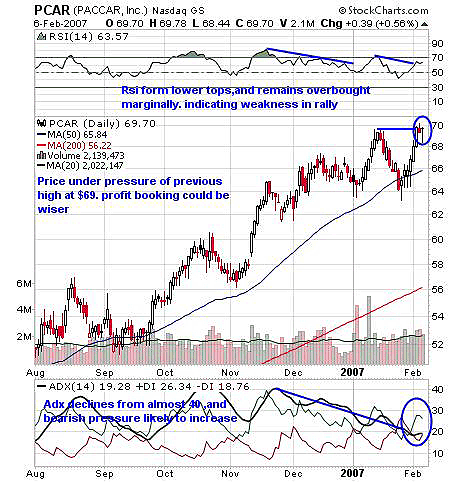
| In Figure 1, a daily chart of Paccar Inc. (PCAR), the relative strength index (RSI)(14) has turned marginally overbought from highly overbought, forming lower tops on the RSI and indicating losing strength in rally. This indicator usually gives low-risk buying at 50 levels. One such buying level can be seen at $64 when the RSI was at the 40 level. So when RSI moved from 40 to 50, fresh buying was possible at $65. Now, traders should book profits on this rally since the price stands near its previous high resistance. Traders should also note the inverted hammer (on February 5) and doji (on February 6) formed on the chart. The inverted hammer is a bearish formation and the doji candle indicates indecision. |
| Again, the average directional movement index (ADX)(14) has declined below 20, showing the possibility of consolidation. -DI has turned up, indicating more bearish pressure, whereas +DI is moving down. Considering these moves, I request traders to take profits, as this stock can return to its previous low while consolidating. |
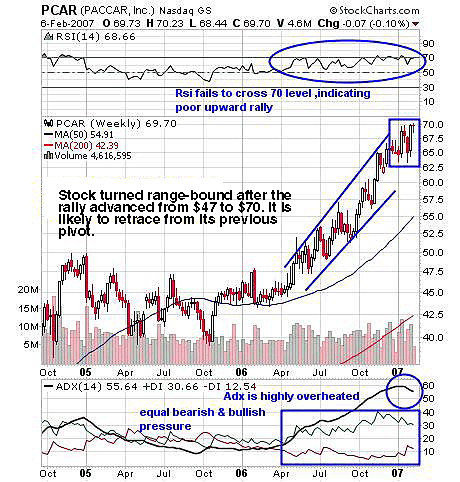
| PCAR moves sideways after its vertical move from $47 to $70. The stock is moving in the range of $62-$70. When the ADX is highly overheated, the stock is likely to consolidate. The ADX on the weekly chart of PCAR (Figure 2) is overheated at 60 and has declined to 55. Still, at this current level the ADX is overheated, so it is likely to continue declining. +DI and -DI are constantly moving with equal pace, showing the tough fight between buyer and seller, though the uptrend remains. The RSI is unable to hold at 70 during the vertical move. It has dipped below 60, weakening strength of rally. At the current level of 68, the RSI is overbought but traders should also follow the ADX movement. Accordingly, I would advise traders to take profits on PCAR. |

|
| FIGURE 1: PCAR, DAILY. Paccar is under strong resistance of the previous high. |
| Graphic provided by: StockCharts.com. |
| |
| The stock has already entered a range on a weekly chart, so it can retrace to its previous low of $62 during consolidation. Traders need to remain cautious and book profits. |

|
| FIGURE 2: PCAR, WEEKLY. Paccar moves in an upward channel and then consolidates sideways. |
| Graphic provided by: StockCharts.com. |
| |
Active trader in the Indian stock markets since 2003 and a full-time writer. Trading is largely based upon technical analysis.
| Company: | Independent |
| Address: | C1/3 Parth Indraprasth Towers. Vastrapur |
| Ahmedabad, Guj 380015 | |
| E-mail address: | chaitalimohile@yahoo.co.in |
Traders' Resource Links | |
| Independent has not added any product or service information to TRADERS' RESOURCE. | |
Click here for more information about our publications!
Comments
Date: 02/07/07Rank: 5Comment:
Date: 02/11/07Rank: 4Comment:
Date: 02/20/07Rank: 4Comment:

Request Information From Our Sponsors
- StockCharts.com, Inc.
- Candle Patterns
- Candlestick Charting Explained
- Intermarket Technical Analysis
- John Murphy on Chart Analysis
- John Murphy's Chart Pattern Recognition
- John Murphy's Market Message
- MurphyExplainsMarketAnalysis-Intermarket Analysis
- MurphyExplainsMarketAnalysis-Visual Analysis
- StockCharts.com
- Technical Analysis of the Financial Markets
- The Visual Investor
- VectorVest, Inc.
- Executive Premier Workshop
- One-Day Options Course
- OptionsPro
- Retirement Income Workshop
- Sure-Fire Trading Systems (VectorVest, Inc.)
- Trading as a Business Workshop
- VectorVest 7 EOD
- VectorVest 7 RealTime/IntraDay
- VectorVest AutoTester
- VectorVest Educational Services
- VectorVest OnLine
- VectorVest Options Analyzer
- VectorVest ProGraphics v6.0
- VectorVest ProTrader 7
- VectorVest RealTime Derby Tool
- VectorVest Simulator
- VectorVest Variator
- VectorVest Watchdog
