

HOT TOPICS LIST
- MACD
- Fibonacci
- RSI
- Gann
- ADXR
- Stochastics
- Volume
- Triangles
- Futures
- Cycles
- Volatility
- ZIGZAG
- MESA
- Retracement
- Aroon
INDICATORS LIST
LIST OF TOPICS
PRINT THIS ARTICLE
by David Penn
Measuring more than 55 points, the cup with handle patterns in Sears Holdings projects upside to more than 200.
Position: N/A
David Penn
Technical Writer for Technical Analysis of STOCKS & COMMODITIES magazine, Working-Money.com, and Traders.com Advantage.
PRINT THIS ARTICLE
CUP WITH HANDLE
Sears Holdings' Super Sized Cup With Handle
02/06/07 01:07:09 PMby David Penn
Measuring more than 55 points, the cup with handle patterns in Sears Holdings projects upside to more than 200.
Position: N/A
| One of the first sectors to get going at the end of a period of contraction is the consumer cyclicals. The consumer cyclicals group includes those companies and corporations that produce products that people buy when the economy is strong or improving. This group is also called "consumer discretionary," to underscore the point that the products produced by these companies are things that consumers can do without if need be (during economic downturns or recessions, for example). The sector flow goes something likes this: financials => consumer cyclicals => technology. |
|
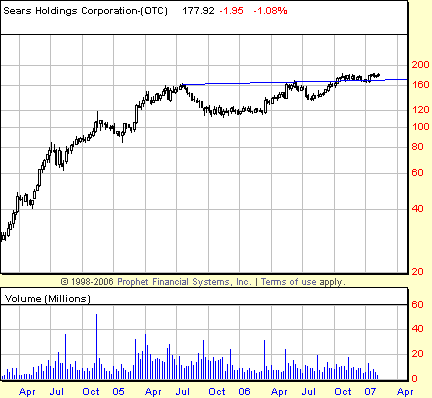
| FIGURE 1: SEARS HOLDINGS, WEEKLY. Having enjoyed a major bull market run going into spring 2005, shares of Sears Holdings settled into a cup with handle consolidation that lasted more than a year. Even after breaking out in the autumn of 2006, SHLD remained near the breakout level of 170. With a formation size of 55-odd points, a minimum upside to 225 looks likely if buyers return. |
| Graphic provided by: Prophet Financial, Inc. |
| |
| It is hard to know if Sears Holdings (SHLD) is a good representative of the consumer cyclical group as a company. After all, we are talking about Sears and Kmart, even if the former does carry my childhood favorite Lands' End line of preppie-light apparel. But as a stock, SLHD has been held up as one way to get exposure to some of the changes in the way the retail business operates, such as Sears Holding CEO Eddie Lambert's notion that being profitiable is more important that traditional retail metrics like same-store sales. That is, if I'm remembering accurately the King of Cramerica's take on the subject. |
| What Sears Holdings represents technically is a market that has spent more than a year in a cup with handle consolidation (Figure 1), a consolidation pattern that is typically a prelude to significantly higher prices. Such patterns in this context are also considered "continuation" patterns. The cup with handle pattern was one of the few patterns flagged by William O'Neil as "one of the most fundamental chart-based patterns" out there, and derives its name from its resemblance to a teacup in profile. Typically, after the formation of the smaller dip called the "handle," the market breaks out to the upside, though in some instances (such as the one in Sears Holdings currently), prices may hug the breakout level after an initial break before moving decisively higher. |
|
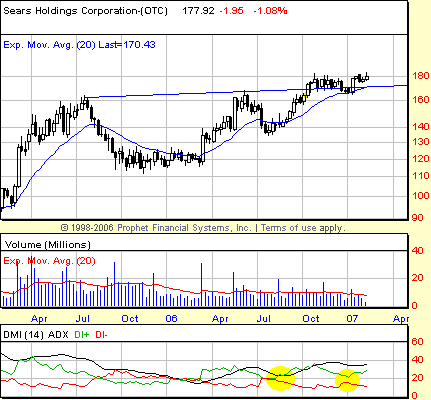
| FIGURE 2: SEARS HOLDINGS, WEEKLY. Highlighted in yellow are two key shifts in the ADX/DMI indicator. The first indicates a crossing of the bullish DI+ (in green) over the bearish DI- (in red). The second indicates an instance where the DI+ line pulls back and then breaks away from the DI- line. Note how the separation occurs as an above-average volume day powers SHLD back above the breakout line near 170. |
| Graphic provided by: Prophet Financial, Inc. |
| |
| Sears Holdings actually had a solid 2006, beginning the year near 120, at the lowest point of the multimonth consolidation range. It was in the first quarter of 2006 that the average directional movement index (ADX) line (in black) first crossed from below 20 back above that level, while at the same time breaking out above the bearish DI- line (in red) (Figure 2). As I wrote recently in my Working-Money.com article, "Trading The DI+/-" (October 12, 2006), this movement by the ADX is particularly bullish, all the more so appearing on a weekly chart. From that time, SHLD rallied to 160 (a move of more than 30%) before retracing about half that advance during the midyear correction only to rally and not only take out the 160 level but challenge the 180 level as well. |
| Long rallies need long consolidations, opportunities for profits to be taken and new positions to be established. While the range of the consolidation is wide, the consolidation doesn't feature the sort of zigzagging pattern that would reflect a lot of buying at the low point of the consolidation and selling at the high. Instead, a gradual profit-taking in the third quarter of 2005 let to two quarters of largely flat trading and then more buying in the second quarter of 2006. The fact that the selling that followed that bout of buying in 2006 did not establish a significant lower low is another promising sign for those who think retail is headed higher and are looking toward SHLD for a ride in that direction. |
Technical Writer for Technical Analysis of STOCKS & COMMODITIES magazine, Working-Money.com, and Traders.com Advantage.
| Title: | Technical Writer |
| Company: | Technical Analysis, Inc. |
| Address: | 4757 California Avenue SW |
| Seattle, WA 98116 | |
| Phone # for sales: | 206 938 0570 |
| Fax: | 206 938 1307 |
| Website: | www.Traders.com |
| E-mail address: | DPenn@traders.com |
Traders' Resource Links | |
| Charting the Stock Market: The Wyckoff Method -- Books | |
| Working-Money.com -- Online Trading Services | |
| Traders.com Advantage -- Online Trading Services | |
| Technical Analysis of Stocks & Commodities -- Publications and Newsletters | |
| Working Money, at Working-Money.com -- Publications and Newsletters | |
| Traders.com Advantage -- Publications and Newsletters | |
| Professional Traders Starter Kit -- Software | |
Click here for more information about our publications!
Comments
Date:�02/07/07Rank:�3Comment:�

Request Information From Our Sponsors
- VectorVest, Inc.
- Executive Premier Workshop
- One-Day Options Course
- OptionsPro
- Retirement Income Workshop
- Sure-Fire Trading Systems (VectorVest, Inc.)
- Trading as a Business Workshop
- VectorVest 7 EOD
- VectorVest 7 RealTime/IntraDay
- VectorVest AutoTester
- VectorVest Educational Services
- VectorVest OnLine
- VectorVest Options Analyzer
- VectorVest ProGraphics v6.0
- VectorVest ProTrader 7
- VectorVest RealTime Derby Tool
- VectorVest Simulator
- VectorVest Variator
- VectorVest Watchdog
- StockCharts.com, Inc.
- Candle Patterns
- Candlestick Charting Explained
- Intermarket Technical Analysis
- John Murphy on Chart Analysis
- John Murphy's Chart Pattern Recognition
- John Murphy's Market Message
- MurphyExplainsMarketAnalysis-Intermarket Analysis
- MurphyExplainsMarketAnalysis-Visual Analysis
- StockCharts.com
- Technical Analysis of the Financial Markets
- The Visual Investor