HOT TOPICS LIST
- MACD
- Fibonacci
- RSI
- Gann
- ADXR
- Stochastics
- Volume
- Triangles
- Futures
- Cycles
- Volatility
- ZIGZAG
- MESA
- Retracement
- Aroon
INDICATORS LIST
LIST OF TOPICS
PRINT THIS ARTICLE
by Arthur Hill
Qualcomm has been stuck in a trading range since August 2006, and another oversold reading from a key momentum oscillator points to a bounce.
Position: Accumulate
Arthur Hill
Arthur Hill is currently editor of TDTrader.com, a website specializing in trading strategies, sector/industry specific breadth stats and overall technical analysis. He passed the Society of Technical Analysts (STA London) diploma exam with distinction is a Certified Financial Technician (CFTe). Prior to TD Trader, he was the Chief Technical Analyst for Stockcharts.com and the main contributor to the ChartSchool.
PRINT THIS ARTICLE
STOCHASTIC OSCILL
Playing The Range With Qualcomm
02/06/07 01:50:07 PMby Arthur Hill
Qualcomm has been stuck in a trading range since August 2006, and another oversold reading from a key momentum oscillator points to a bounce.
Position: Accumulate
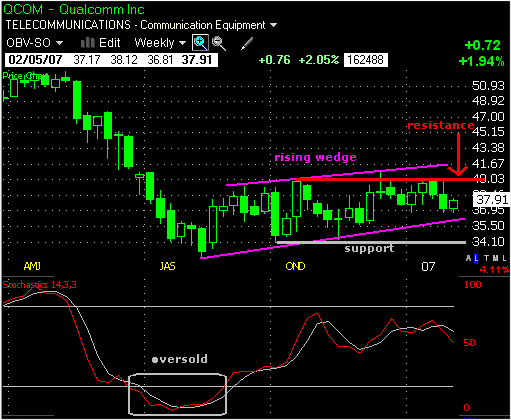
| I will first start out with the weekly chart for some perspective (Figure 1). Qualcomm (QCOM) declined sharply in the first half of 2006 and bottomed in August. The stock then embarked on a trading range that is currently more than five months old. This range has a slight upward bias and represents a big consolidation after the stock became oversold in August; the 14-week stochastics moved below 20 in mid-June and was oversold until mid-August. A break below consolidation support at 34 would signal a continuation of the prior decline and be very bearish for Qualcomm. |

|
| FIGURE 1: QCOM, WEEKLY. Qualcomm declined sharply in the first half of 2006 and bottomed in August. QCOM then embarked on a trading range that is currently over five months old. |
| Graphic provided by: Telechart 2007. |
| |
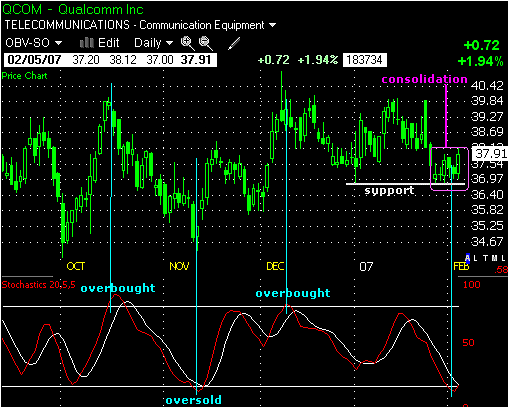
| On the daily chart (Figure 2), I am using the stochastic oscillator to identify potential reversal points within the trading range. This oscillator becomes overbought above 80 and oversold below 20. Because of the trading range, I do not expect overbought and oversold conditions to last long. These are used to anticipate a reversal within the range. Instead of using the normal (14,3) stochastic oscillator setting, I have elected to use (20,5). This longer setting smooths the oscillator and produces fewer signals. |

|
| FIGURE 2: QCOM, DAILY. The stochastic oscillator became overbought above 80 and oversold below 20. |
| Graphic provided by: Telechart 2007. |
| |
| There have been four overbought or oversold readings since October 2006 (blue vertical lines), and these corresponded well with short-term reversals in the stock. October 2006 and December 2006 produced overbought readings, while November 2006 and February 2007 produced oversold readings. The last reading was oversold, and this occurred two days ago. QCOM is trading near support from the January 3rd low, and traders should prepare for a bounce. In fact, the stock consolidated the last five to six days and I would watch this range for the next signal. A break above 38.12 would be short-term bullish and a break below 36.8 would be short-term bearish. |
Arthur Hill is currently editor of TDTrader.com, a website specializing in trading strategies, sector/industry specific breadth stats and overall technical analysis. He passed the Society of Technical Analysts (STA London) diploma exam with distinction is a Certified Financial Technician (CFTe). Prior to TD Trader, he was the Chief Technical Analyst for Stockcharts.com and the main contributor to the ChartSchool.
| Title: | Editor |
| Company: | TDTrader.com |
| Address: | Willem Geetsstraat 17 |
| Mechelen, B2800 | |
| Phone # for sales: | 3215345465 |
| Website: | www.tdtrader.com |
| E-mail address: | arthurh@tdtrader.com |
Traders' Resource Links | |
| TDTrader.com has not added any product or service information to TRADERS' RESOURCE. | |
Click here for more information about our publications!
Comments
Date: 02/07/07Rank: 4Comment:
Date: 02/13/07Rank: 5Comment:

Request Information From Our Sponsors
- VectorVest, Inc.
- Executive Premier Workshop
- One-Day Options Course
- OptionsPro
- Retirement Income Workshop
- Sure-Fire Trading Systems (VectorVest, Inc.)
- Trading as a Business Workshop
- VectorVest 7 EOD
- VectorVest 7 RealTime/IntraDay
- VectorVest AutoTester
- VectorVest Educational Services
- VectorVest OnLine
- VectorVest Options Analyzer
- VectorVest ProGraphics v6.0
- VectorVest ProTrader 7
- VectorVest RealTime Derby Tool
- VectorVest Simulator
- VectorVest Variator
- VectorVest Watchdog
- StockCharts.com, Inc.
- Candle Patterns
- Candlestick Charting Explained
- Intermarket Technical Analysis
- John Murphy on Chart Analysis
- John Murphy's Chart Pattern Recognition
- John Murphy's Market Message
- MurphyExplainsMarketAnalysis-Intermarket Analysis
- MurphyExplainsMarketAnalysis-Visual Analysis
- StockCharts.com
- Technical Analysis of the Financial Markets
- The Visual Investor
