

HOT TOPICS LIST
- MACD
- Fibonacci
- RSI
- Gann
- ADXR
- Stochastics
- Volume
- Triangles
- Futures
- Cycles
- Volatility
- ZIGZAG
- MESA
- Retracement
- Aroon
INDICATORS LIST
LIST OF TOPICS
PRINT THIS ARTICLE
by Arthur Hill
Intel consolidates and prepares for its next move. Its on-balance volume points to a breakout, but the stock must first fill a gap.
Position: Accumulate
Arthur Hill
Arthur Hill is currently editor of TDTrader.com, a website specializing in trading strategies, sector/industry specific breadth stats and overall technical analysis. He passed the Society of Technical Analysts (STA London) diploma exam with distinction is a Certified Financial Technician (CFTe). Prior to TD Trader, he was the Chief Technical Analyst for Stockcharts.com and the main contributor to the ChartSchool.
PRINT THIS ARTICLE
ON BALANCE VOLUME
Intel Gears Up For A Move
02/06/07 10:49:52 AMby Arthur Hill
Intel consolidates and prepares for its next move. Its on-balance volume points to a breakout, but the stock must first fill a gap.
Position: Accumulate
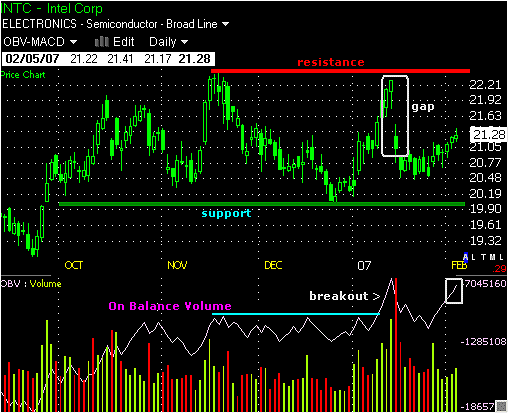
| Intel (INTC) first moved above 21 in mid-October 2006 and the stock has gone nowhere since this surge (Figure 1). INTC has been stuck in a trading range with support at 20 and resistance at 22.5. The stock surged above 22 in mid-November and mid-December, but both surges failed to hold and these reaction highs established key resistance at 22.5. The stock gapped down after the December surge and has yet to fully recover. INTC must fill the gap and break key resistance at 22.5 to escape this trading range and revive the bulls. |
|
| FIGURE 1: INTC, DAILY. Intel first moved above 21 in mid-October and the stock has gone nowhere since this surge. |
| Graphic provided by: Telechart 2007. |
| |
| Despite a trading range over the last few months, the on-balance volume (OBV) continues to move higher and shows signs of continued buying pressure. This cumulative indicator adds volume on up days and subtracts volume on down days. OBV broke above its November high in mid-January 2007 and then fell back after the stock gapped lower. Even though the stock remains close to support, OBV has already moved back to its mid-January high and shows buying pressure. This favors a breakout. |
|
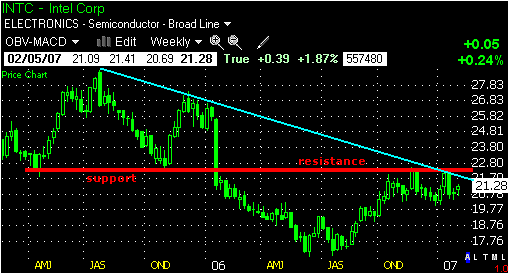
| FIGURE 2: INTC, WEEKLY. Though not visible on the weekly chart, the support break occurred with a big gap down. |
| Graphic provided by: Telechart 2007. |
| |
| The importance of resistance is clear on the weekly chart (Figure 2). INTC broke support around 22.5 in January 2006 and this support break turned into resistance. Though not visible on the weekly chart, this support break occurred with a big gap down. The trendline extending down from July 2005 also marks resistance at 22.5. A break above this level would not only break range resistance on the daily chart, but it would also forge a nice breakout on the weekly chart and project further strength toward 27–28. |
Arthur Hill is currently editor of TDTrader.com, a website specializing in trading strategies, sector/industry specific breadth stats and overall technical analysis. He passed the Society of Technical Analysts (STA London) diploma exam with distinction is a Certified Financial Technician (CFTe). Prior to TD Trader, he was the Chief Technical Analyst for Stockcharts.com and the main contributor to the ChartSchool.
| Title: | Editor |
| Company: | TDTrader.com |
| Address: | Willem Geetsstraat 17 |
| Mechelen, B2800 | |
| Phone # for sales: | 3215345465 |
| Website: | www.tdtrader.com |
| E-mail address: | arthurh@tdtrader.com |
Traders' Resource Links | |
| TDTrader.com has not added any product or service information to TRADERS' RESOURCE. | |
Click here for more information about our publications!
Comments
Date:�02/07/07Rank:�4Comment:�

Request Information From Our Sponsors
- VectorVest, Inc.
- Executive Premier Workshop
- One-Day Options Course
- OptionsPro
- Retirement Income Workshop
- Sure-Fire Trading Systems (VectorVest, Inc.)
- Trading as a Business Workshop
- VectorVest 7 EOD
- VectorVest 7 RealTime/IntraDay
- VectorVest AutoTester
- VectorVest Educational Services
- VectorVest OnLine
- VectorVest Options Analyzer
- VectorVest ProGraphics v6.0
- VectorVest ProTrader 7
- VectorVest RealTime Derby Tool
- VectorVest Simulator
- VectorVest Variator
- VectorVest Watchdog
- StockCharts.com, Inc.
- Candle Patterns
- Candlestick Charting Explained
- Intermarket Technical Analysis
- John Murphy on Chart Analysis
- John Murphy's Chart Pattern Recognition
- John Murphy's Market Message
- MurphyExplainsMarketAnalysis-Intermarket Analysis
- MurphyExplainsMarketAnalysis-Visual Analysis
- StockCharts.com
- Technical Analysis of the Financial Markets
- The Visual Investor