HOT TOPICS LIST
- MACD
- Fibonacci
- RSI
- Gann
- ADXR
- Stochastics
- Volume
- Triangles
- Futures
- Cycles
- Volatility
- ZIGZAG
- MESA
- Retracement
- Aroon
INDICATORS LIST
LIST OF TOPICS
PRINT THIS ARTICLE
by David Penn
Positive divergences in the MACD histogram and stochastic both point to higher long-term rates in the weekly chart of the $TNX.
Position: N/A
David Penn
Technical Writer for Technical Analysis of STOCKS & COMMODITIES magazine, Working-Money.com, and Traders.com Advantage.
PRINT THIS ARTICLE
REVERSAL
Four Points High And Rising
02/06/07 10:28:40 AMby David Penn
Positive divergences in the MACD histogram and stochastic both point to higher long-term rates in the weekly chart of the $TNX.
Position: N/A
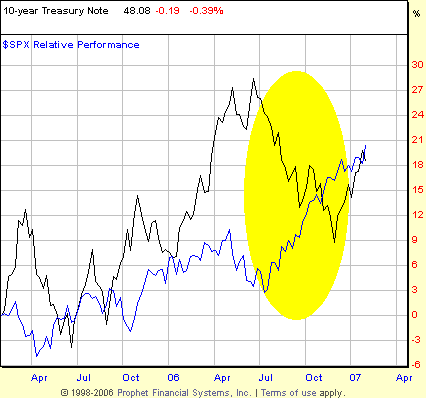
| Overlay the rally in the stock market since the mid-summer 2006 bottom with a chart of the yield on the 10-year Treasury note and what do you get? By all appearances, an impressive picture of inverse correlation. |

|
| FIGURE 1: COMPARISON CHART, 10-YEAR TREASURY NOTE YIELD INDEX VS. S&P 500, WEEKLY. While moving more or less in tandem going into the summer of 2006, a peaking of longer-term interest rates late in the second quarter of 2006 coincided with a significant bottom in the S&P 500. |
| Graphic provided by: Prophet Financial, Inc. |
| |
| Long-term interest rates and stock prices aren't always inversely correlated. In fact, while the yield on the 10-year note advanced from just over 4.0% in late summer 2005 to a high of 5.2% in early summer 2006, the Standard & Poor's 500 climbed from roughly 1150 to 1325. And to be sure, the bounce in the 10-year yield in the middle of the fourth quarter of 2006 hasn't stopped the advance in stocks from powering higher — with new, all-time highs recorded in the Dow Jones transports, for instance. See Figure 1. |
| This renewed fellowship between stocks and long-term interest rates will likely be tested in the event that 10-year rates continue to move higher, an event that seems increasingly likely. The odds for higher long-term interest rates have been enhanced by the presence of two positive divergences — one in the moving average convergence/divergence (MACD) histogram and one in the stochastic — in the weekly chart of $TNX, the index of the yield on the 10-year Treasury note. See Figure 2. |

|
| FIGURE 2: 10-YEAR TREASURY NOTE YIELD INDEX, WEEKLY. Positive divergences in the MACD histogram and the stochastic in this weekly chart suggest that the break above moving average resistance is likely to have staying power. A swing rule projection of the dip below the two moving averages suggests an upside to the 52 level. |
| Graphic provided by: Prophet Financial, Inc. |
| |
| Divergences have done a fairly good job of anticipating changes in direction in the $TNX. The top in the late spring/early summer of 2006 was anticipated by negative divergences in both the MACD histogram and the stochastic, as was the low in the late spring of 2005, when the yield index on the 10-year Treasury flirted with the 38 level. This provides for a sound technical reason to pay attention to what the divergences — again, weekly divergences — are suggesting about the near term for the 10-year note. |
| While a move lower — either to test moving average resistance-turned-support or to burn off some of the overbought condition the $TNX developed in late January — may take place, it is likely that the 44 level will remain the key low for sometime. It will certainly be a level worth watching in the event that any correction in the current rally in $TNX begins to encourage onlookers to believe that lower longer-term rates are back with any persistence. |
Technical Writer for Technical Analysis of STOCKS & COMMODITIES magazine, Working-Money.com, and Traders.com Advantage.
| Title: | Technical Writer |
| Company: | Technical Analysis, Inc. |
| Address: | 4757 California Avenue SW |
| Seattle, WA 98116 | |
| Phone # for sales: | 206 938 0570 |
| Fax: | 206 938 1307 |
| Website: | www.Traders.com |
| E-mail address: | DPenn@traders.com |
Traders' Resource Links | |
| Charting the Stock Market: The Wyckoff Method -- Books | |
| Working-Money.com -- Online Trading Services | |
| Traders.com Advantage -- Online Trading Services | |
| Technical Analysis of Stocks & Commodities -- Publications and Newsletters | |
| Working Money, at Working-Money.com -- Publications and Newsletters | |
| Traders.com Advantage -- Publications and Newsletters | |
| Professional Traders Starter Kit -- Software | |
Click here for more information about our publications!
Comments
Date: 02/07/07Rank: 3Comment:

Request Information From Our Sponsors
- VectorVest, Inc.
- Executive Premier Workshop
- One-Day Options Course
- OptionsPro
- Retirement Income Workshop
- Sure-Fire Trading Systems (VectorVest, Inc.)
- Trading as a Business Workshop
- VectorVest 7 EOD
- VectorVest 7 RealTime/IntraDay
- VectorVest AutoTester
- VectorVest Educational Services
- VectorVest OnLine
- VectorVest Options Analyzer
- VectorVest ProGraphics v6.0
- VectorVest ProTrader 7
- VectorVest RealTime Derby Tool
- VectorVest Simulator
- VectorVest Variator
- VectorVest Watchdog
- StockCharts.com, Inc.
- Candle Patterns
- Candlestick Charting Explained
- Intermarket Technical Analysis
- John Murphy on Chart Analysis
- John Murphy's Chart Pattern Recognition
- John Murphy's Market Message
- MurphyExplainsMarketAnalysis-Intermarket Analysis
- MurphyExplainsMarketAnalysis-Visual Analysis
- StockCharts.com
- Technical Analysis of the Financial Markets
- The Visual Investor
