HOT TOPICS LIST
- MACD
- Fibonacci
- RSI
- Gann
- ADXR
- Stochastics
- Volume
- Triangles
- Futures
- Cycles
- Volatility
- ZIGZAG
- MESA
- Retracement
- Aroon
INDICATORS LIST
LIST OF TOPICS
PRINT THIS ARTICLE
by David Penn
Does a long-term sideways correction in gold need more downside?
Position: N/A
David Penn
Technical Writer for Technical Analysis of STOCKS & COMMODITIES magazine, Working-Money.com, and Traders.com Advantage.
PRINT THIS ARTICLE
CONSOLID FORMATION
Lower Before Higher For Gold
02/06/07 10:12:27 AMby David Penn
Does a long-term sideways correction in gold need more downside?
Position: N/A
| Back in late December 2006, I opined on the various short-, intermediate-, and longer-term trends in gold for Traders.com Advantage ("Gold's Three Trends," December 21, 2006). The takeaway from that article was that gold's bearish intermediate trend, a trend that began in spring 2006, appeared to have ended with a breakout in late October. I suggested that gold was likely to continue moving higher in the short term, a call that was confirmed when the gold market put in a higher low in early January 2007 and moved to challenge the post-breakout high from November. |

|
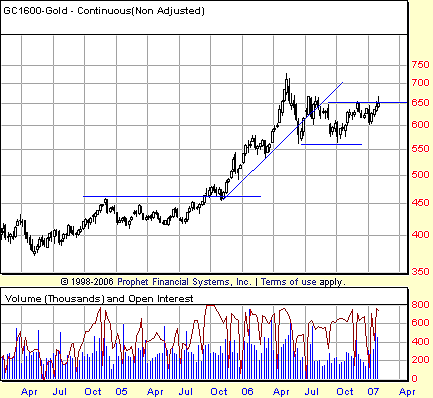
| FIGURE 1: GOLD, CONTINUOUS FUTURES, WEEKLY. Note gold's breakout in fourth-quarter 2005. Since late in second-quarter 2006, gold has been testing its breakout trendline in a classic 1-2-3 trend reversal setup. Follow-through below about 550 or upside above 650 will be necessary to confirm either resumption or a reversal in trend. |
| Graphic provided by: Prophet Financial, Inc. |
| |
| That high was exceeded on a daily basis in earliest February on both the continuous and April futures gold charts. The question for gold traders was whether gold would finally break through above the $660 level (basis continuous futures). There are some signs that this fourth attempt will, at least initially, fail as well. But in that failure could lay an opportunity for those who have been looking to take a position in gold, but were waiting for a more buyer-friendly level. |
| The weekly chart of gold futures in Figure 1 shows a market that is working its way fitfully through a 1-2-3 trend reversal setup. I say "fitfully" because while the downside and upside limits of the reversal, at roughly 550 and 650, respectively, have been tested, neither has been breached. It would take a breach of either level on a closing basis and, more important, follow-through, to indicate that a significant break from the consolidation had occurred. |

|
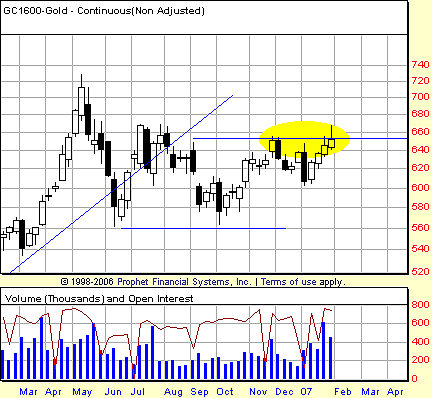
| FIGURE 2: GOLD, CONTINUOUS FUTURES, WEEKLY. The most recent, short-term advance in gold has left the traders with a potential 2B/Turtle Soup top. Should the next short-term move take out the low of the November high, then traders should be prepared for a test of the 600 level and, perhaps, of the 580 level as well. |
| Graphic provided by: Prophet Financial, Inc. |
| |
| The challenge for gold will be to show follow-through to the upside after making a higher high in January 2007 vis-a-vis November 2006. Although the candlesticks in the past two weeks suggest a market that is running a little short of steam on the upside, it still takes a negative session for a reversal to occur. In particular, traders focusing on the downside should look to see whether gold moves below, roughly, the 630 level. This level corresponds to the low of the November high. Breaching that level would trigger a sell based on the 2B and Turtle Soup top methodologies (Figure 2). |
| In that event, traders should expect a trading week's worth of decline at a minimum, given the size of the 2B top (see my Working-Money article, "Breakouts, Pullbacks, And Gaming The 2B" from January 24, 2007, for more recent thoughts on 2B/Turtle Soup tops). How far might a correction run? It seems to me as if a test of the 600 level would be a minimum requirement for any correction worth the name. And if any correction that occurs uses that between-peak low from early January as a pivot point, then a swing rule projection lower suggests a gold market could test the correction lows near 560 as well. Such a correction might be ideal for patient bulls insofar as losing the 600 level would likely reflect the requisite pessimism that would be required for the gold correction — now into its 10th month — to end. |
Technical Writer for Technical Analysis of STOCKS & COMMODITIES magazine, Working-Money.com, and Traders.com Advantage.
| Title: | Technical Writer |
| Company: | Technical Analysis, Inc. |
| Address: | 4757 California Avenue SW |
| Seattle, WA 98116 | |
| Phone # for sales: | 206 938 0570 |
| Fax: | 206 938 1307 |
| Website: | www.Traders.com |
| E-mail address: | DPenn@traders.com |
Traders' Resource Links | |
| Charting the Stock Market: The Wyckoff Method -- Books | |
| Working-Money.com -- Online Trading Services | |
| Traders.com Advantage -- Online Trading Services | |
| Technical Analysis of Stocks & Commodities -- Publications and Newsletters | |
| Working Money, at Working-Money.com -- Publications and Newsletters | |
| Traders.com Advantage -- Publications and Newsletters | |
| Professional Traders Starter Kit -- Software | |
Click here for more information about our publications!
Comments
Date: 02/07/07Rank: 3Comment:

Request Information From Our Sponsors
- VectorVest, Inc.
- Executive Premier Workshop
- One-Day Options Course
- OptionsPro
- Retirement Income Workshop
- Sure-Fire Trading Systems (VectorVest, Inc.)
- Trading as a Business Workshop
- VectorVest 7 EOD
- VectorVest 7 RealTime/IntraDay
- VectorVest AutoTester
- VectorVest Educational Services
- VectorVest OnLine
- VectorVest Options Analyzer
- VectorVest ProGraphics v6.0
- VectorVest ProTrader 7
- VectorVest RealTime Derby Tool
- VectorVest Simulator
- VectorVest Variator
- VectorVest Watchdog
- StockCharts.com, Inc.
- Candle Patterns
- Candlestick Charting Explained
- Intermarket Technical Analysis
- John Murphy on Chart Analysis
- John Murphy's Chart Pattern Recognition
- John Murphy's Market Message
- MurphyExplainsMarketAnalysis-Intermarket Analysis
- MurphyExplainsMarketAnalysis-Visual Analysis
- StockCharts.com
- Technical Analysis of the Financial Markets
- The Visual Investor
