HOT TOPICS LIST
- MACD
- Fibonacci
- RSI
- Gann
- ADXR
- Stochastics
- Volume
- Triangles
- Futures
- Cycles
- Volatility
- ZIGZAG
- MESA
- Retracement
- Aroon
INDICATORS LIST
LIST OF TOPICS
PRINT THIS ARTICLE
by Arthur Hill
Verisign is breaking out on the daily chart and this breakout bodes well for an even bigger resistance break on the weekly chart.
Position: Accumulate
Arthur Hill
Arthur Hill is currently editor of TDTrader.com, a website specializing in trading strategies, sector/industry specific breadth stats and overall technical analysis. He passed the Society of Technical Analysts (STA London) diploma exam with distinction is a Certified Financial Technician (CFTe). Prior to TD Trader, he was the Chief Technical Analyst for Stockcharts.com and the main contributor to the ChartSchool.
PRINT THIS ARTICLE
CHANNEL LINES
A Channel Breakout For Verisign
02/01/07 03:24:09 PMby Arthur Hill
Verisign is breaking out on the daily chart and this breakout bodes well for an even bigger resistance break on the weekly chart.
Position: Accumulate
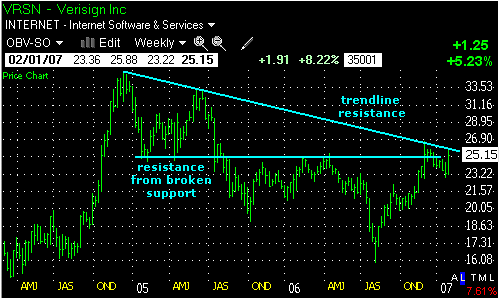
| First, let's start with the weekly chart (Figure 1) and get some perspective. Verisign (VRSN) declined between December 2004 to August 2006. The stock broke support around 25 and this level turned into resistance in November 2005, February 2006, April 2006, and August 2006. In addition, there was resistance around 26 from the December 2004 trendline. Taken together, there was one big resistance zone around 25–26 and the stock stalled in this area in the last eight to nine weeks. As you can see, a breakout on the daily chart (Figure 2) would likely lead to a breakout on the weekly chart and this would be quite bullish for Verisign. |

|
| FIGURE 1: VERISIGN, WEEKLY. The stock declined from December 2004 to August 2006. |
| Graphic provided by: Telechart 2007. |
| |
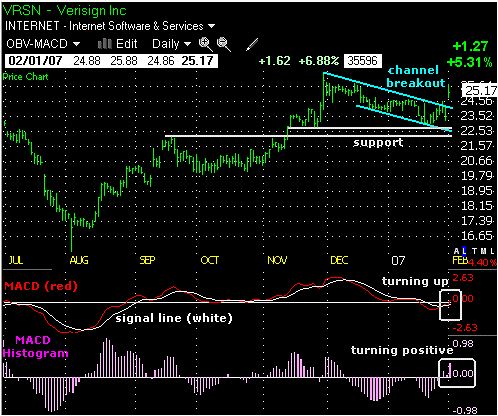
| Turning to the daily chart, there are signs of life with a gap up and breakout. The stock advanced from August to late November and then corrected in December and January. I am calling this a correction because it retraced a 50–62% of the October–November advance and formed a falling price channel. Both the retracement and the pattern are typical for corrections. There is also support around 22.50 from the late November consolidation and broken resistance (September high). The February 1st gap broke the upper channel trendline and this signals a continuation of the prior advance. This gap should be considered bullish as long as it holds and a move below 23.4 would negate the breakout. As I write this (mid-morning on February 1), the gap is only a few hours old. |

|
| FIGURE 2: VERISIGN, DAILY. The stock is inching its way back up. |
| Graphic provided by: Telechart 2007. |
| |
| Momentum confirms the breakout as 5-35 moving average convergence/divergence (MACD) moved up over the last few days. Instead of the usually nine-day exponential moving average (EMA) and 26-day EMA for MACD, I am using a five-day EMA and 35-day EMA. This makes the indicator more sensitive and produces more signals. The oscillator turned up and broke into positive territory on Thursday. In addition,the MACD histogram (magenta lines) turned positive three days ago. This means the MACD (red line) moved above its signal line, which is the nine-day EMA of MACD (white line). As long as this oscillator remains in positive territory and above its signal line, I will treat the breakout as bullish and expect higher prices. |
Arthur Hill is currently editor of TDTrader.com, a website specializing in trading strategies, sector/industry specific breadth stats and overall technical analysis. He passed the Society of Technical Analysts (STA London) diploma exam with distinction is a Certified Financial Technician (CFTe). Prior to TD Trader, he was the Chief Technical Analyst for Stockcharts.com and the main contributor to the ChartSchool.
| Title: | Editor |
| Company: | TDTrader.com |
| Address: | Willem Geetsstraat 17 |
| Mechelen, B2800 | |
| Phone # for sales: | 3215345465 |
| Website: | www.tdtrader.com |
| E-mail address: | arthurh@tdtrader.com |
Traders' Resource Links | |
| TDTrader.com has not added any product or service information to TRADERS' RESOURCE. | |
Click here for more information about our publications!
Comments
Date: 02/02/07Rank: 4Comment:

|

Request Information From Our Sponsors
- VectorVest, Inc.
- Executive Premier Workshop
- One-Day Options Course
- OptionsPro
- Retirement Income Workshop
- Sure-Fire Trading Systems (VectorVest, Inc.)
- Trading as a Business Workshop
- VectorVest 7 EOD
- VectorVest 7 RealTime/IntraDay
- VectorVest AutoTester
- VectorVest Educational Services
- VectorVest OnLine
- VectorVest Options Analyzer
- VectorVest ProGraphics v6.0
- VectorVest ProTrader 7
- VectorVest RealTime Derby Tool
- VectorVest Simulator
- VectorVest Variator
- VectorVest Watchdog
- StockCharts.com, Inc.
- Candle Patterns
- Candlestick Charting Explained
- Intermarket Technical Analysis
- John Murphy on Chart Analysis
- John Murphy's Chart Pattern Recognition
- John Murphy's Market Message
- MurphyExplainsMarketAnalysis-Intermarket Analysis
- MurphyExplainsMarketAnalysis-Visual Analysis
- StockCharts.com
- Technical Analysis of the Financial Markets
- The Visual Investor
