HOT TOPICS LIST
- MACD
- Fibonacci
- RSI
- Gann
- ADXR
- Stochastics
- Volume
- Triangles
- Futures
- Cycles
- Volatility
- ZIGZAG
- MESA
- Retracement
- Aroon
INDICATORS LIST
LIST OF TOPICS
PRINT THIS ARTICLE
by Gary Grosschadl
Verizon Communications vaults higher with a classic chart pattern — cup with handle.
Position: Buy
Gary Grosschadl
Independent Canadian equities trader and technical analyst based in Peterborough
Ontario, Canada.
PRINT THIS ARTICLE
CUP WITH HANDLE
Verizon Breakout
02/01/07 03:12:20 PMby Gary Grosschadl
Verizon Communications vaults higher with a classic chart pattern — cup with handle.
Position: Buy
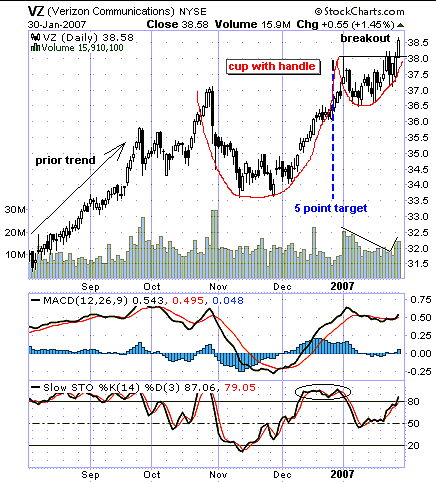
| Cup with handle patterns were first identified by William O'Neil in his 1988 classic work, How To Make Money In Stocks. The cup and handle is a longer-term continuation pattern, normally observed on weekly charts, but this daily chart is more timely as the breakout just occurred in this time frame (Figure 1). The cup pattern should take a minimum of seven weeks to form. The handle may form over several weeks, even months. |
| This entire formation is a consolidation period. A subsequent breakout from the handle's trading range signals a continuation of the prior advance. The volume during the handle formation should be contracting and the breakout should be on higher volume. |

|
| FIGURE 1: VERIZON, DAILY. VZ shows breakouts on this daily chart. |
| Graphic provided by: StockCharts.com. |
| |
| Figure 1 clearly shows the prior rising trend and then a consolidation period forming a nicely rounded cup. As the handle forms, volume contracts and then expands on breakout of the handle. The size of the advance can be estimated to equal the maximum height of the cup at the right side as applied above the breakout point. In this case, a five-point advance would target $43 but does not mean it can't go higher. |
| Two indicators are worth a comment. The moving average convergence/divergence (MACD) also reflects a well-formed cup and handle and hints at the resumption of a strong trend. The stochastic oscillator shows a move to an overbought zone but note how this stayed overbought for an extended time during the rise from the bottom of the cup. This reminds traders that during a strong rising trend this oscillator is not a trend strength indicator (however, the MACD is). |
| A surprise move below a recent low, say $37, would negate the cup and handle breakout. This would be a reasonable stop-loss point. In the meantime, the bulls should move this one higher toward the initial target of $43. |
Independent Canadian equities trader and technical analyst based in Peterborough
Ontario, Canada.
| Website: | www.whatsonsale.ca/financial.html |
| E-mail address: | gwg7@sympatico.ca |
Click here for more information about our publications!
Comments
Date: 02/02/07Rank: 5Comment:

Request Information From Our Sponsors
- VectorVest, Inc.
- Executive Premier Workshop
- One-Day Options Course
- OptionsPro
- Retirement Income Workshop
- Sure-Fire Trading Systems (VectorVest, Inc.)
- Trading as a Business Workshop
- VectorVest 7 EOD
- VectorVest 7 RealTime/IntraDay
- VectorVest AutoTester
- VectorVest Educational Services
- VectorVest OnLine
- VectorVest Options Analyzer
- VectorVest ProGraphics v6.0
- VectorVest ProTrader 7
- VectorVest RealTime Derby Tool
- VectorVest Simulator
- VectorVest Variator
- VectorVest Watchdog
- StockCharts.com, Inc.
- Candle Patterns
- Candlestick Charting Explained
- Intermarket Technical Analysis
- John Murphy on Chart Analysis
- John Murphy's Chart Pattern Recognition
- John Murphy's Market Message
- MurphyExplainsMarketAnalysis-Intermarket Analysis
- MurphyExplainsMarketAnalysis-Visual Analysis
- StockCharts.com
- Technical Analysis of the Financial Markets
- The Visual Investor
