HOT TOPICS LIST
- MACD
- Fibonacci
- RSI
- Gann
- ADXR
- Stochastics
- Volume
- Triangles
- Futures
- Cycles
- Volatility
- ZIGZAG
- MESA
- Retracement
- Aroon
INDICATORS LIST
LIST OF TOPICS
PRINT THIS ARTICLE
by Chaitali Mohile
When Capitol Federal Financial forms similar patterns on more than one time frame, more strength is accumulated for the next directional move.
Position: Buy
Chaitali Mohile
Active trader in the Indian stock markets since 2003 and a full-time writer. Trading is largely based upon technical analysis.
PRINT THIS ARTICLE
ASCENDING TRIANGLES
CFFN Moves Out With Double Strength
02/05/07 09:24:08 AMby Chaitali Mohile
When Capitol Federal Financial forms similar patterns on more than one time frame, more strength is accumulated for the next directional move.
Position: Buy
| The ascending triangle is among the formations that are easily recognized by their shapes. This triangle is a bullish formation that occurs in the middle of an uptrend. It is considered to be a continuation pattern of a previous rally. As the price moves in a narrow range, the volume reduces. The ascending triangle is made of a horizontal line referred to as a "sellers' line" and an upward sloping line called a "buyers' line." |
| The breakout direction of this triangle is always upward. For a breakout, the sellers' line — that is, the resistance line of the triangle — should be crossed with a higher volume. The price is likely to touch its newly formed support line after breakout as well, so traders are requested to watch the movement even after a breakout. The target is calculated by adding the width of a triangle to the breakout level. On Figure 1 and 2, Capitol Federal Financial (CFFN) has moved out of an ascending triangle, reinforcing its strength. |
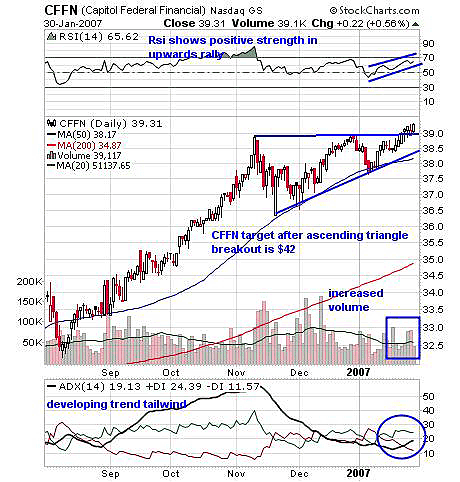
| In Figure 1, the stock is moving in a narrower range since mid-November, forming a riangular structure. The lower level is seen narrowing further, making an upward-sloping line. The volume increases as the price breaks out of the triangle. The average direction index (ADX)(14) indicates a developing uptrend as it moves toward 20. The relative strength index (RSI)(14) is 65, showing more upward rally strength. Traders and investors can go long with a target of $42 on daily basis. To calculate the target width of the triangle, $3 ($36–$39) is added to the breakout level of $39. The stop-loss for this trader is $37.5 — that is, the previous low. |

|
| FIGURE 1: CAPITOL FEDERAL FINANCIAL, DAILY. CFFN has been moving in a narrower range since mid-November, forming a triangular structure. |
| Graphic provided by: StockCharts.com. |
| |
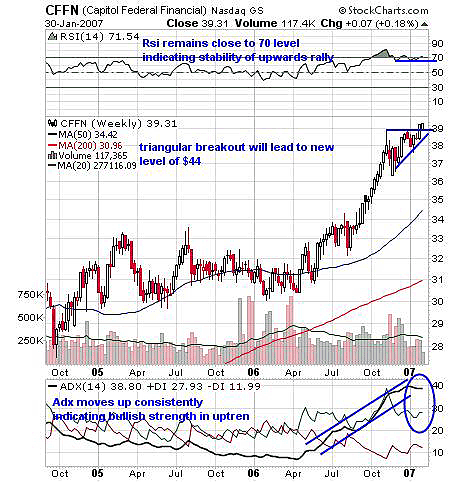
| A similar ascending triangle formation can be seen on Figure 2. CFFN has crossed the seller line upward. The RSI (14) is constantly moving near 70 levels during this movement within triangle, showing a bullish strength in a rally after breakout. The ADX (14) moved consistently from the 10 to the 40 level. Now, it has declined to 38, maintaining the bullish trend. A weekly target of $44 is calculated, assuming the previous run from $34 to $39. By adding this $5 to $39, we get this target. |

|
| FIGURE 1: CAPITOL FEDERAL FINANCIAL, WEEKLY. CFFN has crossed the seller's line upward. |
| Graphic provided by: StockCharts.com. |
| |
| As a result, CFFN has gathered extra strength by moving out of an ascending triangle on two time frames. I recommend this stock. |
Active trader in the Indian stock markets since 2003 and a full-time writer. Trading is largely based upon technical analysis.
| Company: | Independent |
| Address: | C1/3 Parth Indraprasth Towers. Vastrapur |
| Ahmedabad, Guj 380015 | |
| E-mail address: | chaitalimohile@yahoo.co.in |
Traders' Resource Links | |
| Independent has not added any product or service information to TRADERS' RESOURCE. | |
Click here for more information about our publications!
Comments
Date: 02/05/07Rank: 4Comment:

Request Information From Our Sponsors
- StockCharts.com, Inc.
- Candle Patterns
- Candlestick Charting Explained
- Intermarket Technical Analysis
- John Murphy on Chart Analysis
- John Murphy's Chart Pattern Recognition
- John Murphy's Market Message
- MurphyExplainsMarketAnalysis-Intermarket Analysis
- MurphyExplainsMarketAnalysis-Visual Analysis
- StockCharts.com
- Technical Analysis of the Financial Markets
- The Visual Investor
- VectorVest, Inc.
- Executive Premier Workshop
- One-Day Options Course
- OptionsPro
- Retirement Income Workshop
- Sure-Fire Trading Systems (VectorVest, Inc.)
- Trading as a Business Workshop
- VectorVest 7 EOD
- VectorVest 7 RealTime/IntraDay
- VectorVest AutoTester
- VectorVest Educational Services
- VectorVest OnLine
- VectorVest Options Analyzer
- VectorVest ProGraphics v6.0
- VectorVest ProTrader 7
- VectorVest RealTime Derby Tool
- VectorVest Simulator
- VectorVest Variator
- VectorVest Watchdog
