HOT TOPICS LIST
- MACD
- Fibonacci
- RSI
- Gann
- ADXR
- Stochastics
- Volume
- Triangles
- Futures
- Cycles
- Volatility
- ZIGZAG
- MESA
- Retracement
- Aroon
INDICATORS LIST
LIST OF TOPICS
PRINT THIS ARTICLE
by David Penn
Positive divergences in the MACD histogram anticipated the late January bounce in crude oil prices.
Position: N/A
David Penn
Technical Writer for Technical Analysis of STOCKS & COMMODITIES magazine, Working-Money.com, and Traders.com Advantage.
PRINT THIS ARTICLE
REVERSAL
A Crude Bounce
01/31/07 09:05:44 AMby David Penn
Positive divergences in the MACD histogram anticipated the late January bounce in crude oil prices.
Position: N/A
| A few weeks ago in Traders.com Advantage, I pointed out how negative divergences in the OIH (the Oil Service HOLDRS) that developed during December 2006 resulted in the collapse in oil shares in January ("Crackin' Crude," January 4, 2007). At the time, the OIH was trading at a little over 133 after suffering a 4.5% single-session drop. The OIH would move lower still, finally putting in a bottom on January 11 at a price only pennies above 126 (another 5% lower). Back in "Crackin' Crude," I wrote that: But if the OIH does not hold up at this level (132), traders should be prepared for a steeper decline to, perhaps, the 126 level. This level is potentially significant insofar as it matches up with both a swing rule projection downward from the December topping pattern (150–138 in height), as well as being near the 78.6% retracement level. Other than taking my word for it, what clues might traders and speculators have used in order to game the bottom in the OIH — and by extension, crude oil — correction? Some of the best clues to the bottoms that developed in both the OIH and crude oil could be found in the hourly charts of both. In both the OIH and crude oil, positive divergences in the moving average convergence/divergence histogram (MACDH) could be seen developing by January 11 in the OIH and only a few days later in crude oil futures. |

|
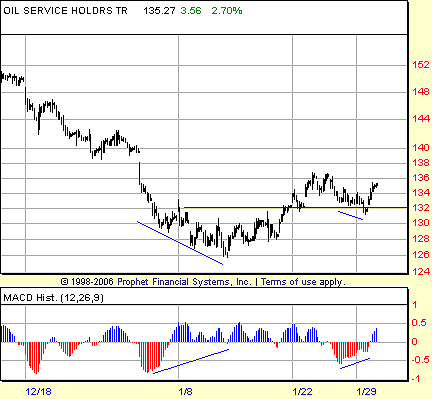
| FIGURE 1: OIL SERVICE HOLDRS, HOURLY. The deep MACDH trough on January 3 and 4 was the signal for traders to begin anticipating the possibility of a positive divergence if prices made a lower low while the next histogram trough created a higher low. Note also the relatively smaller positive divergence late in the month as the OIH pulls back to the breakout level. |
| Graphic provided by: Prophet Financial, Inc. |
| |
| Let's look first at the OIH insofar as it was both the subject of my earlier article as well the current leader in the intermarket push-me/pull-you relationship between commodities and commodity stocks. The OIH was plunging through the second half of December 2006. In early January, OIH made an extremely deep MACD histogram trough (Figure 1). This trough alerted traders to two things: First, that the OIH had further to fall, and second, that there was an increasing possibility that the next lower low in price would be the final low for the correction. The first alert proved true enough. The early January MACDH trough made its lowest point on January 3 with the OIH at 133. And while the OIH would move lower, the MACDH would make no lower trough. The second alert was not perfect insofar as the next low in price (January 9) did not represent the true bottom, which would not come until January 11. But that trough put traders on notice that the time for being short was running out and that the risks were shifting in favor of the bulls. As it turned out, the true bottom on January 11 was barely a point lower than the low from January 9. |
| I want to point out one thing not shown in Figure 1. There was an even deeper MACDH trough back on December 18–19. While this trough, taken in context with the trough from early January, does contribute to the positive divergence thesis, I don't include it because it arrives far too early in the OIH's correction to be considered part of the bottoming process (the "positive divergence" bottoming process). I refer to such extremely deep MACD histogram troughs that occur early in a correction as "breakdown troughs." These troughs are best used to warn traders that lower prices are likely (see more on this use of MACD histogram troughs in my Working-Money.com article, "Post-Breakdown MACDH Extremes," from May 19, 2004). |

|
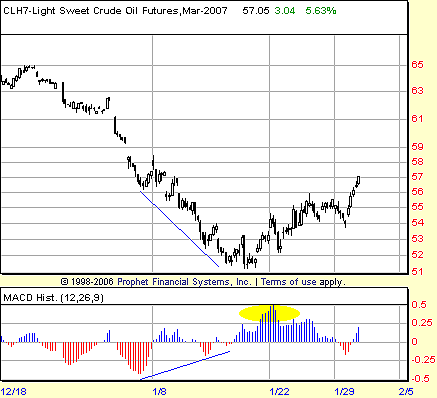
| FIGURE 2: CRUDE OIL, MARCH FUTURES, HOURLY. Positive MACDH divergences helped anticipate the mid-January bounce in March crude oil futures. Note the MACD histogram spike that occurred during March crude's initial advance off the lows. This was further confirmation that a bottom was in and that higher prices — particularly vis-a-vis the price highs that accompanied the MACDH spike — were to come. |
| Graphic provided by: Prophet Financial, Inc. |
| |
| Turning to the bounce in crude oil that came only days after the bounce in the OIH, we see much of the same setup. A prolonged downturn forms initially a very deep MACDH trough. But as prices continue to move lower, the MACDH troughs become more and more shallow. This suggests a loss of momentum to the downside, the first prerequisite for the end of a bear turn in the market. What is especially interesting about the March crude chart in Figure 2 is that it clearly shows the MACD histogram spike that accompanied the initial move off the bottom. Such spikes are often excellent tells that the market has indeed bottomed for the time being, and that the market in question is ready to move higher. |
| Whether the current rally in crude oil and oil shares represents the beginning of a new move higher or merely an oversold bounce, these divergences did traders and speculators a big favor by alerting them to the possibility that profits on the short side were best taken swiftly. |
Technical Writer for Technical Analysis of STOCKS & COMMODITIES magazine, Working-Money.com, and Traders.com Advantage.
| Title: | Technical Writer |
| Company: | Technical Analysis, Inc. |
| Address: | 4757 California Avenue SW |
| Seattle, WA 98116 | |
| Phone # for sales: | 206 938 0570 |
| Fax: | 206 938 1307 |
| Website: | www.Traders.com |
| E-mail address: | DPenn@traders.com |
Traders' Resource Links | |
| Charting the Stock Market: The Wyckoff Method -- Books | |
| Working-Money.com -- Online Trading Services | |
| Traders.com Advantage -- Online Trading Services | |
| Technical Analysis of Stocks & Commodities -- Publications and Newsletters | |
| Working Money, at Working-Money.com -- Publications and Newsletters | |
| Traders.com Advantage -- Publications and Newsletters | |
| Professional Traders Starter Kit -- Software | |
Click here for more information about our publications!
Comments
Date: 01/31/07Rank: 3Comment:

|

Request Information From Our Sponsors
- StockCharts.com, Inc.
- Candle Patterns
- Candlestick Charting Explained
- Intermarket Technical Analysis
- John Murphy on Chart Analysis
- John Murphy's Chart Pattern Recognition
- John Murphy's Market Message
- MurphyExplainsMarketAnalysis-Intermarket Analysis
- MurphyExplainsMarketAnalysis-Visual Analysis
- StockCharts.com
- Technical Analysis of the Financial Markets
- The Visual Investor
- VectorVest, Inc.
- Executive Premier Workshop
- One-Day Options Course
- OptionsPro
- Retirement Income Workshop
- Sure-Fire Trading Systems (VectorVest, Inc.)
- Trading as a Business Workshop
- VectorVest 7 EOD
- VectorVest 7 RealTime/IntraDay
- VectorVest AutoTester
- VectorVest Educational Services
- VectorVest OnLine
- VectorVest Options Analyzer
- VectorVest ProGraphics v6.0
- VectorVest ProTrader 7
- VectorVest RealTime Derby Tool
- VectorVest Simulator
- VectorVest Variator
- VectorVest Watchdog
