HOT TOPICS LIST
- MACD
- Fibonacci
- RSI
- Gann
- ADXR
- Stochastics
- Volume
- Triangles
- Futures
- Cycles
- Volatility
- ZIGZAG
- MESA
- Retracement
- Aroon
INDICATORS LIST
LIST OF TOPICS
PRINT THIS ARTICLE
by Chaitali Mohile
Bottomline Technologies has regained its strength after a sharp correction. It may try to approach its previous high of $18 with a support of moving average.
Position: Buy
Chaitali Mohile
Active trader in the Indian stock markets since 2003 and a full-time writer. Trading is largely based upon technical analysis.
PRINT THIS ARTICLE
TECHNICAL ANALYSIS
Sharp Pullback In EPAY
02/05/07 01:31:17 PMby Chaitali Mohile
Bottomline Technologies has regained its strength after a sharp correction. It may try to approach its previous high of $18 with a support of moving average.
Position: Buy
| Corrections occur in all stocks and commodities even in an uptrend. The uptrending stock tops out or forms a lower high during the existing move, indicating the bear is getting stronger. The short side becomes heavier than the long-side traders. A correction does not mean a change in trend until it gets the support from other sectors of the market. The stock regains its strength after the correction is strong while certain stocks turn laggard in such conditions; they lose their tailwind. Traders should avoid such stocks. |

|
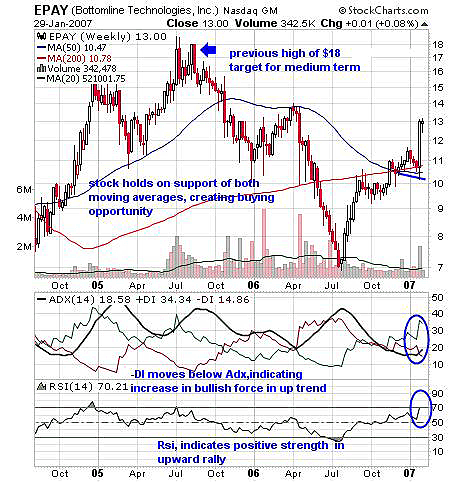
| FIGURE 1: EPAY, WEEKLY. Bottom Technologies formed a double top at the $18 level. |
| Graphic provided by: StockCharts.com. |
| |
| On Figure 1, the Bottom Technologies stock (EPAY) formed a double top at the $18 level. From here the stock corrected sharply till $7. The trend could be in danger if the stock continued falling further. EPAY established support just below $7, pulling back sharply. As a trader, I would just watch the market action till the 200-day moving average (MA) resistance turns to be the support for rally. |
| In Figure 1, price moved sharply from $7 to $10.50. In Figure 2, the 200-day MA resistance crossed upward with increased volume. Volume always plays an important role during breakout. The stock now stands on the support of both the moving averages. Meanwhile, the average directional index (ADX) (14) is 18, indicating the developing trend and reinforcing bullish pressure. And the relative strength index (RSI)(14) is overbought, showing decent room for further rally, and hence, the trader can go long with target of previous high -- ie, $18. |

|
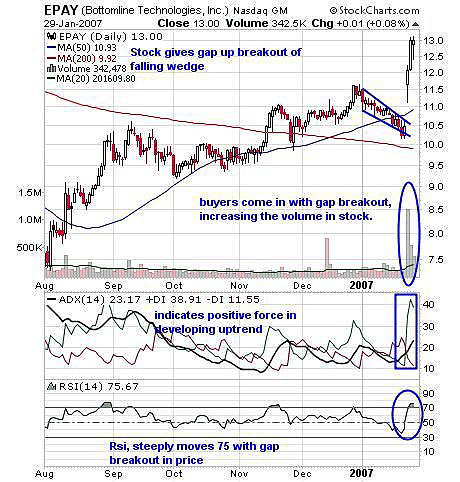
| FIGURE 2: EPAY, DAILY. The gap breakout happened on much higher volume. |
| Graphic provided by: StockCharts.com. |
| |
| A gap-up breakout of a falling wedge is seen in Figure 2. A falling wedge is a small correction in an up move and generally occurs in the middle of an up move. The price often retraces its previous low or support level. It has a bullish bias for breakout. In Figure 2, the gap breakout occurred on much higher volume. Followed by a gap breakout, ADX and RSI also moved steeply in bullish mode. The ADX(14) at 23 combined with +DI at 38 indicates developing bullish strength in trend. The RSI (14) can maintain its overbought position for longer periods as well. Traders and investors can take a fresh long trade at current levels. |
| Thus, the traders should look to buy this stock. The stock that holds an important support level after the pullback is a strong one. |
Active trader in the Indian stock markets since 2003 and a full-time writer. Trading is largely based upon technical analysis.
| Company: | Independent |
| Address: | C1/3 Parth Indraprasth Towers. Vastrapur |
| Ahmedabad, Guj 380015 | |
| E-mail address: | chaitalimohile@yahoo.co.in |
Traders' Resource Links | |
| Independent has not added any product or service information to TRADERS' RESOURCE. | |
Click here for more information about our publications!
Comments
Date: 02/05/07Rank: 4Comment:

Request Information From Our Sponsors
- StockCharts.com, Inc.
- Candle Patterns
- Candlestick Charting Explained
- Intermarket Technical Analysis
- John Murphy on Chart Analysis
- John Murphy's Chart Pattern Recognition
- John Murphy's Market Message
- MurphyExplainsMarketAnalysis-Intermarket Analysis
- MurphyExplainsMarketAnalysis-Visual Analysis
- StockCharts.com
- Technical Analysis of the Financial Markets
- The Visual Investor
- VectorVest, Inc.
- Executive Premier Workshop
- One-Day Options Course
- OptionsPro
- Retirement Income Workshop
- Sure-Fire Trading Systems (VectorVest, Inc.)
- Trading as a Business Workshop
- VectorVest 7 EOD
- VectorVest 7 RealTime/IntraDay
- VectorVest AutoTester
- VectorVest Educational Services
- VectorVest OnLine
- VectorVest Options Analyzer
- VectorVest ProGraphics v6.0
- VectorVest ProTrader 7
- VectorVest RealTime Derby Tool
- VectorVest Simulator
- VectorVest Variator
- VectorVest Watchdog
