HOT TOPICS LIST
- MACD
- Fibonacci
- RSI
- Gann
- ADXR
- Stochastics
- Volume
- Triangles
- Futures
- Cycles
- Volatility
- ZIGZAG
- MESA
- Retracement
- Aroon
INDICATORS LIST
LIST OF TOPICS
PRINT THIS ARTICLE
by Gary Grosschadl
Canada's second-largest telecommunications company rose past the $50 mark several months ago and now may be ready to challenge its $65 high.
Position: Buy
Gary Grosschadl
Independent Canadian equities trader and technical analyst based in Peterborough
Ontario, Canada.
PRINT THIS ARTICLE
CHART ANALYSIS
Telus Corp. Bouncing Off Support
01/30/07 09:02:29 AMby Gary Grosschadl
Canada's second-largest telecommunications company rose past the $50 mark several months ago and now may be ready to challenge its $65 high.
Position: Buy
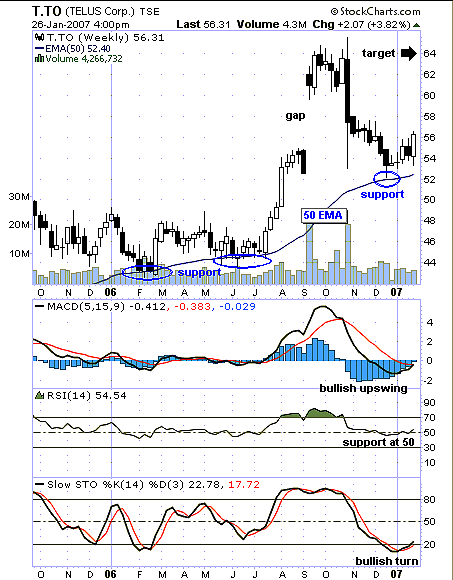
| Figure 1 shows a rapid move from $50 to $65, including a gap higher. In the short term this move was unsustainable, and the stock corrected to close the gap and find support. |
| The stock has a history of support at its 50-period exponential moving average (EMA), so coming down to this support test made technical sense. Now that the stock has corrected it is showing signs of another upleg developing. The most obvious trading target in the short term is the previous high area of $64. That is not to say that it can't keep going higher, but some kind of consolidation may be in store, tempting some profit-taking. |

|
| FIGURE 1: TELUS, WEEKLY. The Telus stock corrects to its 50-period EMA support. |
| Graphic provided by: StockCharts.com. |
| |
| Several indicators hint at an upleg under way. The moving average convergence/divergence (MACD) has turned up from lower levels and appears to be on the verge of a bullish crossover of its signal line. The relative strength index (RSI) has found support at its often-key area of 50. Meanwhile, the stochastic oscillator is showing a bullish turn from low levels. Moving above its 20 level is normally taken to be the start of an upleg. |
| If the stock makes a surprise move below the 50 EMA, then the bullish tone of this article is negated and previous lows may be tested. In the meantime, the stock appears to be headed higher. |
Independent Canadian equities trader and technical analyst based in Peterborough
Ontario, Canada.
| Website: | www.whatsonsale.ca/financial.html |
| E-mail address: | gwg7@sympatico.ca |
Click here for more information about our publications!
Comments
Date: 01/31/07Rank: 5Comment:

Request Information From Our Sponsors
- StockCharts.com, Inc.
- Candle Patterns
- Candlestick Charting Explained
- Intermarket Technical Analysis
- John Murphy on Chart Analysis
- John Murphy's Chart Pattern Recognition
- John Murphy's Market Message
- MurphyExplainsMarketAnalysis-Intermarket Analysis
- MurphyExplainsMarketAnalysis-Visual Analysis
- StockCharts.com
- Technical Analysis of the Financial Markets
- The Visual Investor
- VectorVest, Inc.
- Executive Premier Workshop
- One-Day Options Course
- OptionsPro
- Retirement Income Workshop
- Sure-Fire Trading Systems (VectorVest, Inc.)
- Trading as a Business Workshop
- VectorVest 7 EOD
- VectorVest 7 RealTime/IntraDay
- VectorVest AutoTester
- VectorVest Educational Services
- VectorVest OnLine
- VectorVest Options Analyzer
- VectorVest ProGraphics v6.0
- VectorVest ProTrader 7
- VectorVest RealTime Derby Tool
- VectorVest Simulator
- VectorVest Variator
- VectorVest Watchdog
