

HOT TOPICS LIST
- MACD
- Fibonacci
- RSI
- Gann
- ADXR
- Stochastics
- Volume
- Triangles
- Futures
- Cycles
- Volatility
- ZIGZAG
- MESA
- Retracement
- Aroon
INDICATORS LIST
LIST OF TOPICS
PRINT THIS ARTICLE
by Dennis D. Peterson
Edwin Sedgewick Coppock devised an indicator that compares past performance to current and may give us an insight into the Nasdaq.
Position: N/A
Dennis D. Peterson
Market index trading on a daily basis.
PRINT THIS ARTICLE
RATE OF CHANGE
Nasdaq and the Coppock Curve
11/03/00 01:51:52 PMby Dennis D. Peterson
Edwin Sedgewick Coppock devised an indicator that compares past performance to current and may give us an insight into the Nasdaq.
Position: N/A
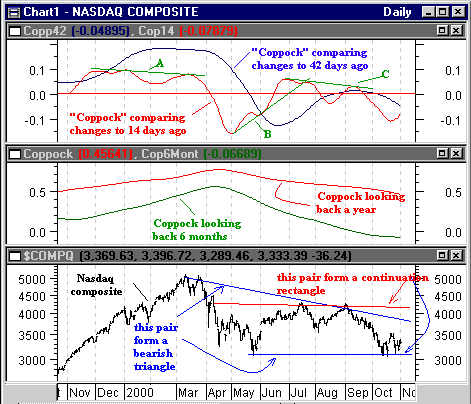
| Edwin Sedgewick Coppock devised an indicator that won him praise in 1962 and applied to the DJIA with success. The underlying premise of the indicator still holds today. Coppock proposed that by comparing the change a year ago with changes today, we can see if our sentiment today is bullish or bearish. Investors can remain wary of downside events for a period of time and Coppock reasoned this wariness disappears after a year. How wary are Nasdaq technology investors? The Coppock formula for Metastock is: (Mov(ROC(Mov(C,22,S),250,%),150,E))/100. |
| By breaking down the formula you can see that first a simple moving average for the last 22 days is obtained, MOV(C,22,S). You then determine how today's 22-day moving average compares, in percentage terms, with one taken 250 days ago by using the rate of change function, ROC(MOV(C,22,S),250,%). Finally, smooth the data one more time by taking the exponential moving average for 150 days of the ROC (rate of change), of the changes between today and a year ago (Figure 1 - middle chart). Since you are comparing prices this is a momentum indicator. Using the 22-day moving average simply smooths the noise out to make the comparison between today and a year ago more legitimate. To give readers a chance to see what a formula for approximately six months might look like, I changed the smoothing from 22 to 14 days, the lookback to 120 days, and used a 90-day exponential smoothing average (Figure 1 - middle chart: (Mov(ROC(Mov(C,14,S),120,%),90,E))/100) ). The six month lookback suggests the market is bearish relative to that point. The one year lookback says it is about where it was a year ago (as it turns out so are the prices). |
|
| Figure 1: Nasdaq with possible patterns (bottom chart), Coppock lookbacks for Nasdaq (middle chart), Coppock-like indicators for Nasdaq (top chart). |
| Graphic provided by: MetaStock. |
| |
| What would happen if I were to change this a little bit? Suppose I make the same comparison but use exponentials throughout the formula to make it more responsive and still use a ratio. I would get the change over the last period relative to today's price. The formula in Metastock I used is: Mov((Mov(C,14,E)-Mov(Ref(C,-14),14,E))/Mov(C,14,E),14,E). The formula compares today's 14-day smoothed value of price with the price change 14 days ago. If prices are up relative to where they were 14 days ago the formula is positive and if down, the formula is negative. Why divide by price? Suppose there is a $10 change for a stock that costs $100, a ten percent increase. Suppose the $10 change is for a stock that costs $10, a 100% increase. In one case there is moderate volatility and the other, extreme volatility. I used a similar formula using 42 days: Mov((Mov(C,42,E)-Mov(Ref(C,-42),42,E))/Mov(C,42,E),42,E). |
| The two are shown as "Coppock" in the top chart of Figure 1. Many readers will recognize that these two formulas are extremely close to ROC (rate of change). Some subtle changes are introduced based on Coppock's work. The first is to use moving averages rather than just the data "n" periods ago. Moving averages are akin to low pass filters. They let the underlying slower moving changes pass through while filtering out the rapid changes. So the purpose in this case is take out the daily trading noise, and try and see where the "underlying" market wants to go. Moving averages pay a price, however, in being a lagging indicator and are generally only used in trend following systems, so an exponential is used to make them more responsive. A traditional ROC uses the value of the first day of the lookback period. I used today's value as the denominator. Why? If, for example, values are going down, and the ratio is calculated with today's lowered value versus the higher value "n" days ago, dividing the difference with a smaller value results in a larger ratio value. The effect is to generate a slightly more exaggerated indicator, the purpose of which is to see the trend more clearly. In the top chart three trends, A, B and C, are identified. They both confirm and show divergences as an oscillator should. What trend A is saying is that while price changes are positive they are getting successively smaller. What trend B is saying is that negative price changes are getting smaller and finally turn positive, with the positive differences increasing. Trend C is similar to A. |
| Price volatility for the Nasdaq needs to dampen out a bit. High price volatility shows that investors are unsure. A positive sign would be for "Coppock" to trend up. The number of stocks making new lows still exceeds those making new highs but the ratio is coming down. A positive sign. If we look at where the Nasdaq has come since mid-March the formation is obviously bearish. A more near term look, starting with mid-July shows a continuation pattern, a rectangle. If you use Fibonacci retracements, and place the 0% point at the peak in mid-July, and the 100% line at the bottom in May, the 61.8% Fibonacci hits around 3500, an area tested several times. While I would have liked a bullish pattern to have developed, it hasn't yet. The sentiment is becoming neutral and if we can get a breakout above 3500 the next stop will be 3800. |
Market index trading on a daily basis.
| Title: | Staff Writer |
| Company: | Technical Analysis, Inc. |
| Address: | 4757 California Ave SW |
| Seattle, WA 98116-4499 | |
| Phone # for sales: | 206 938 0570 |
| Fax: | 206 938 1307 |
| Website: | www.traders.com |
| E-mail address: | dpeterson@traders.com |
Traders' Resource Links | |
| Charting the Stock Market: The Wyckoff Method -- Books | |
| Working-Money.com -- Online Trading Services | |
| Traders.com Advantage -- Online Trading Services | |
| Technical Analysis of Stocks & Commodities -- Publications and Newsletters | |
| Working Money, at Working-Money.com -- Publications and Newsletters | |
| Traders.com Advantage -- Publications and Newsletters | |
| Professional Traders Starter Kit -- Software | |
Click here for more information about our publications!
Comments

Request Information From Our Sponsors
- StockCharts.com, Inc.
- Candle Patterns
- Candlestick Charting Explained
- Intermarket Technical Analysis
- John Murphy on Chart Analysis
- John Murphy's Chart Pattern Recognition
- John Murphy's Market Message
- MurphyExplainsMarketAnalysis-Intermarket Analysis
- MurphyExplainsMarketAnalysis-Visual Analysis
- StockCharts.com
- Technical Analysis of the Financial Markets
- The Visual Investor
- VectorVest, Inc.
- Executive Premier Workshop
- One-Day Options Course
- OptionsPro
- Retirement Income Workshop
- Sure-Fire Trading Systems (VectorVest, Inc.)
- Trading as a Business Workshop
- VectorVest 7 EOD
- VectorVest 7 RealTime/IntraDay
- VectorVest AutoTester
- VectorVest Educational Services
- VectorVest OnLine
- VectorVest Options Analyzer
- VectorVest ProGraphics v6.0
- VectorVest ProTrader 7
- VectorVest RealTime Derby Tool
- VectorVest Simulator
- VectorVest Variator
- VectorVest Watchdog