HOT TOPICS LIST
- MACD
- Fibonacci
- RSI
- Gann
- ADXR
- Stochastics
- Volume
- Triangles
- Futures
- Cycles
- Volatility
- ZIGZAG
- MESA
- Retracement
- Aroon
INDICATORS LIST
LIST OF TOPICS
PRINT THIS ARTICLE
by Koos van der Merwe
The price of oil should be rising, not falling.
Position: Accumulate
Koos van der Merwe
Has been a technical analyst since 1969, and has worked as a futures and options trader with First Financial Futures in Johannesburg, South Africa.
PRINT THIS ARTICLE
ELLIOTT WAVE
So Where Is Oil Going?
01/23/07 08:21:07 AMby Koos van der Merwe
The price of oil should be rising, not falling.
Position: Accumulate
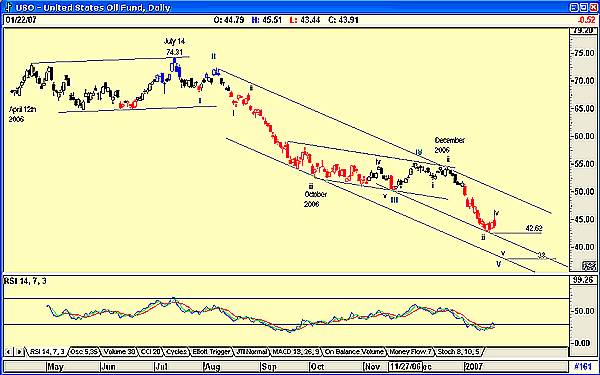
| That is the normal winter pattern, but this winter so far, the pattern has been abnormal. Pundits have blamed the abnormal temperatures on global warming, and those who speculate in a rise of oil prices as winter sets in have to date not been that successful. So when is the time to buy oil shares? Figure 1 is a chart that so far has been pretty accurate in forecasting where oil is going. Let us see how accurate it is from now on. |

|
| FIGURE 1: US OIL FUND, DAILY. A daily chart of the United States Oil Fund, suggesting that a bottom may be in sight, and that oil should by all accounts start strengthening in the not-too-distant future. |
| Graphic provided by: AdvancedGET. |
| |
| The United States Oil Fund, LP (USO), is a new way for investors and hedgers to manage their exposure to energy. The investment objective of USOF is for changes in percentage terms of the units' net asset value to reflect the changes in percentage terms of the spot price of West Texas Intermediate (WTI) light, sweet crude oil delivered to Cushing, OK (WTI light, sweet crude oil), less USOF's expenses. It is designed to give investors a flexible combination of exposure to a leading global commodity with the ease and convenience of an AMEX-listed security. |
| The earliest data I have of the fund is from April 12, 2006, when the price was $68.08. The price rose to $74.31 by July 14 in a sideways pattern, and then... from that date it started falling. Why? Did someone know that the winter would be a mild one? Did they suspect that OPEC would not increase oil prices substantially? Did they suspect that those countries that are substantial users would stockpile oil over the summer months? Whatever the reason, the fund suggested that the trend for oil was down, not up, a trend that is contrary to chart patterns of previous years. |
| The fund price dropped into October 2006 in what looks like a wave iii of a wave III, but as winter settled into a far warmer pattern than previous years, the oil price started falling once again and that in spite of the blizzard that occurred in Denver. So what for the future? A wave count suggests that the oil fund and hence the oil price could continue falling into wave V, a further 10%, approximately. ( $42 - $38 = $4.) The relative strength index (RSI), on the other hand, is suggesting that the price could move up, or should the price of USO follow the previous pattern when the RSI gave a buy signal, at least move sideways. Can the fund be used as an indicator for the movement of future oil prices? So far it has proved itself, contrary to everyone's expectations. Definitely a way to determine which way oil will go. |
Has been a technical analyst since 1969, and has worked as a futures and options trader with First Financial Futures in Johannesburg, South Africa.
| Address: | 3256 West 24th Ave |
| Vancouver, BC | |
| Phone # for sales: | 6042634214 |
| E-mail address: | petroosp@gmail.com |
Click here for more information about our publications!
Comments
Date: 01/26/07Rank: 3Comment:

Request Information From Our Sponsors
- StockCharts.com, Inc.
- Candle Patterns
- Candlestick Charting Explained
- Intermarket Technical Analysis
- John Murphy on Chart Analysis
- John Murphy's Chart Pattern Recognition
- John Murphy's Market Message
- MurphyExplainsMarketAnalysis-Intermarket Analysis
- MurphyExplainsMarketAnalysis-Visual Analysis
- StockCharts.com
- Technical Analysis of the Financial Markets
- The Visual Investor
- VectorVest, Inc.
- Executive Premier Workshop
- One-Day Options Course
- OptionsPro
- Retirement Income Workshop
- Sure-Fire Trading Systems (VectorVest, Inc.)
- Trading as a Business Workshop
- VectorVest 7 EOD
- VectorVest 7 RealTime/IntraDay
- VectorVest AutoTester
- VectorVest Educational Services
- VectorVest OnLine
- VectorVest Options Analyzer
- VectorVest ProGraphics v6.0
- VectorVest ProTrader 7
- VectorVest RealTime Derby Tool
- VectorVest Simulator
- VectorVest Variator
- VectorVest Watchdog
