HOT TOPICS LIST
- MACD
- Fibonacci
- RSI
- Gann
- ADXR
- Stochastics
- Volume
- Triangles
- Futures
- Cycles
- Volatility
- ZIGZAG
- MESA
- Retracement
- Aroon
INDICATORS LIST
LIST OF TOPICS
PRINT THIS ARTICLE
by Chaitali Mohile
USAP breaks out of long range-bound period, offers gap-up buying opportunities for traders and investors.
Position: Buy
Chaitali Mohile
Active trader in the Indian stock markets since 2003 and a full-time writer. Trading is largely based upon technical analysis.
PRINT THIS ARTICLE
GAPS
USAP Gaps Up
01/23/07 09:48:07 AMby Chaitali Mohile
USAP breaks out of long range-bound period, offers gap-up buying opportunities for traders and investors.
Position: Buy
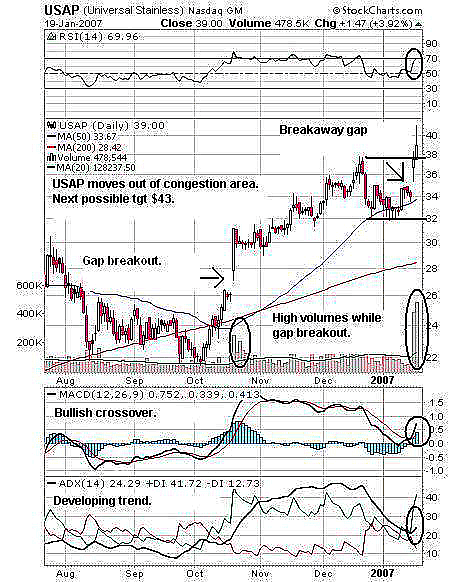
| Figure 1 shows a breakaway gap of Universal Stainless (USAP). Here, price congestion area tops at $36 with a $32 low. This gap breakout has occurred on heavy volume, which is equally important. The relative strength index (RSI) (14) is just 69, which shows more room for an upward rally. When the average directional movement index (ADX) (14) moves above 20, it indicates the developing trend tailwind and end of the trading range. On Figure 1 when the ADX is above 24, that means trend is developing. Meanwhile, the moving average convergence/divergence (MACD) (12,26,9) has moved above its trigger line (9). This breakaway gap can be bought either when the price comes back to test the support of $36 or when the price consolidates. |

|
| FIGURE 1: USAP, DAILY. This chart shows two gap breakouts with heavy volume. |
| Graphic provided by: StockCharts.com. |
| |
| I would recommend traders and investors to go long at the current level with a target of $43. |
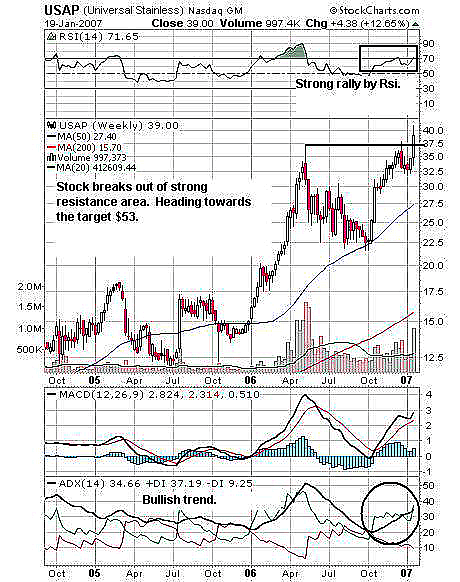
| Previous highs or previous lows are also important for a resistance-support area for further rally. Similarly, on Figure 2, USAP can be seen moving out of its strong resistance area of $37.50, which was its previous high. This breakout gives fresh buying opportunities, but it's always safer to take more confirmation. So for added confirmation, let's look at indicators. The RSI (14) at 71 shows bullish strength in the next rally, as it can remain overbought for a long period. The MACD (12,26,9) also shows positive bullishness in the trend. The ADX indicates strong bullish trend ahead. On a weekly basis too, traders can buy this level with a medium-term target of $53. To calculate this target I have considered the rally from $22.50 to $37.50. Adding $15 (22.50 - 37.50) to $38, we get the above target. |

|
| FIGURE 2: USAP, WEEKLY. Here, the stock breaks out of a strong resistance area, heading toward the target of $53. |
| Graphic provided by: StockCharts.com. |
| |
| As a result, traders and investors should always note that gap breakout with heavy volume can be bought. |
Active trader in the Indian stock markets since 2003 and a full-time writer. Trading is largely based upon technical analysis.
| Company: | Independent |
| Address: | C1/3 Parth Indraprasth Towers. Vastrapur |
| Ahmedabad, Guj 380015 | |
| E-mail address: | chaitalimohile@yahoo.co.in |
Traders' Resource Links | |
| Independent has not added any product or service information to TRADERS' RESOURCE. | |
Click here for more information about our publications!
Comments
Date: 01/23/07Rank: 4Comment:
Date: 01/23/07Rank: 5Comment:

Request Information From Our Sponsors
- StockCharts.com, Inc.
- Candle Patterns
- Candlestick Charting Explained
- Intermarket Technical Analysis
- John Murphy on Chart Analysis
- John Murphy's Chart Pattern Recognition
- John Murphy's Market Message
- MurphyExplainsMarketAnalysis-Intermarket Analysis
- MurphyExplainsMarketAnalysis-Visual Analysis
- StockCharts.com
- Technical Analysis of the Financial Markets
- The Visual Investor
- VectorVest, Inc.
- Executive Premier Workshop
- One-Day Options Course
- OptionsPro
- Retirement Income Workshop
- Sure-Fire Trading Systems (VectorVest, Inc.)
- Trading as a Business Workshop
- VectorVest 7 EOD
- VectorVest 7 RealTime/IntraDay
- VectorVest AutoTester
- VectorVest Educational Services
- VectorVest OnLine
- VectorVest Options Analyzer
- VectorVest ProGraphics v6.0
- VectorVest ProTrader 7
- VectorVest RealTime Derby Tool
- VectorVest Simulator
- VectorVest Variator
- VectorVest Watchdog
