HOT TOPICS LIST
- MACD
- Fibonacci
- RSI
- Gann
- ADXR
- Stochastics
- Volume
- Triangles
- Futures
- Cycles
- Volatility
- ZIGZAG
- MESA
- Retracement
- Aroon
INDICATORS LIST
LIST OF TOPICS
PRINT THIS ARTICLE
by Chaitali Mohile
Apartment Investment and Management Co. shows a strong profit potential.
Position: Buy
Chaitali Mohile
Active trader in the Indian stock markets since 2003 and a full-time writer. Trading is largely based upon technical analysis.
PRINT THIS ARTICLE
FLAGS AND PENNANTS
AIV Gives Fresh Breakout Of Flag Formation
01/23/07 03:59:22 PMby Chaitali Mohile
Apartment Investment and Management Co. shows a strong profit potential.
Position: Buy
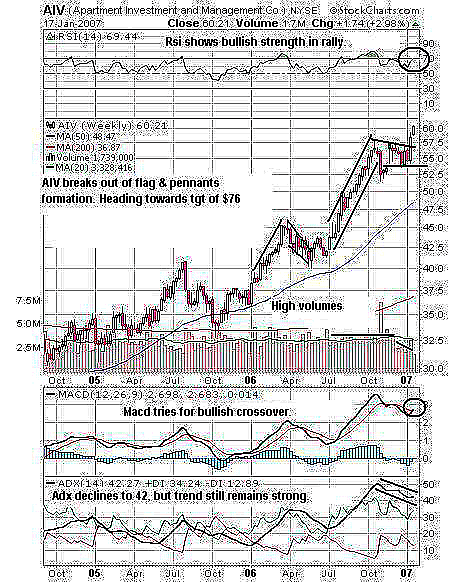
| In Figure 1, the weekly chart shows that Apartment Investment and Management (AIV) started its vertical move from $42 to $57 with higher volume, an important factor. This vertical move of $19 is the flagpole. With a high at $57 the stock started consolidating, forming a flag. Traders can see the price made a breakout at $57 on increased volume. So should we buy this stock? The answer is yes. But to confirm, we must consider the indicators too. |
| The relative strength index (RSI) (14) shows a bullish strength in rally. The average directional movement index (ADX)(14) at the 42 level indicates a strong uptrend. As price started consolidating, the overheated ADX at the 50 level just declined to 42. This indicates the strong uptrend still exists. The moving average convergence/divergence (MACD)(12,26,9) is trying to give a bullish crossover. Though the crossover is still not confirmed, we combine the MACD with the RSI and the ADX. As a result, traders and investors can go long with a target of $76. |

|
| FIGURE 1: AIV, WEEKLY. AIV has made a flag formation twice, with good volume too. |
| Graphic provided by: StockCharts.com. |
| |
| While calculating the target on this formation, the size of the flagpole must be considered. The distance between the lower end and the upper end of flagpole is $19 ($42-$57). So by adding $19 to the pullback level ($57), we get the target of $76. Hence, I would recommend that traders and investors buy this breakout of flag and pennants. |
Active trader in the Indian stock markets since 2003 and a full-time writer. Trading is largely based upon technical analysis.
| Company: | Independent |
| Address: | C1/3 Parth Indraprasth Towers. Vastrapur |
| Ahmedabad, Guj 380015 | |
| E-mail address: | chaitalimohile@yahoo.co.in |
Traders' Resource Links | |
| Independent has not added any product or service information to TRADERS' RESOURCE. | |
Click here for more information about our publications!
Comments
Date: 01/23/07Rank: 4Comment:
Date: 01/24/07Rank: 4Comment:

Request Information From Our Sponsors
- VectorVest, Inc.
- Executive Premier Workshop
- One-Day Options Course
- OptionsPro
- Retirement Income Workshop
- Sure-Fire Trading Systems (VectorVest, Inc.)
- Trading as a Business Workshop
- VectorVest 7 EOD
- VectorVest 7 RealTime/IntraDay
- VectorVest AutoTester
- VectorVest Educational Services
- VectorVest OnLine
- VectorVest Options Analyzer
- VectorVest ProGraphics v6.0
- VectorVest ProTrader 7
- VectorVest RealTime Derby Tool
- VectorVest Simulator
- VectorVest Variator
- VectorVest Watchdog
- StockCharts.com, Inc.
- Candle Patterns
- Candlestick Charting Explained
- Intermarket Technical Analysis
- John Murphy on Chart Analysis
- John Murphy's Chart Pattern Recognition
- John Murphy's Market Message
- MurphyExplainsMarketAnalysis-Intermarket Analysis
- MurphyExplainsMarketAnalysis-Visual Analysis
- StockCharts.com
- Technical Analysis of the Financial Markets
- The Visual Investor
