HOT TOPICS LIST
- MACD
- Fibonacci
- RSI
- Gann
- ADXR
- Stochastics
- Volume
- Triangles
- Futures
- Cycles
- Volatility
- ZIGZAG
- MESA
- Retracement
- Aroon
INDICATORS LIST
LIST OF TOPICS
PRINT THIS ARTICLE
by David Penn
Negative divergences signal a slowdown in the greenback's six-week ascent.
Position: N/A
David Penn
Technical Writer for Technical Analysis of STOCKS & COMMODITIES magazine, Working-Money.com, and Traders.com Advantage.
PRINT THIS ARTICLE
REVERSAL
Correction Time For The Dollar
01/18/07 09:08:48 AMby David Penn
Negative divergences signal a slowdown in the greenback's six-week ascent.
Position: N/A
| As I wrote a month ago, positive divergences were signaling that the December lows in the US dollar were not likely to be exceeded to the downside. Dollar pessimism — both the giddy and the fearful versions — was typically resurgent at the time. We even had the requisite, typically ill-timed prediction that the "dollar would keep falling" from former Federal Reserve Board chairman Alan Greenspan. |

|
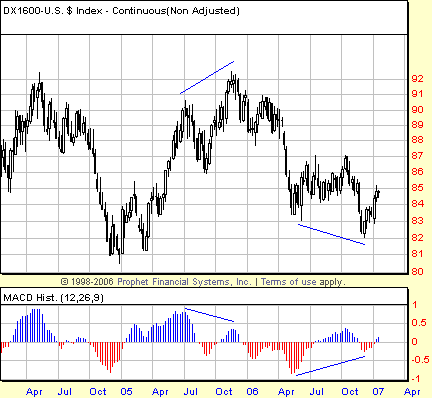
| FIGURE 1: US DOLLAR INDEX, CONTINUOUS FUTURES, WEEKLY. A sizable positive divergence between the spring and winter lows in the greenback in 2006 suggests both that an intermediate bottom has been established as well as a potentially major higher low vis-a-vis the dollar's late 2004 low. |
| Graphic provided by: Prophet Financial, Inc. |
| |
| Since mid-December, the US dollar (basis March) has rallied from 82 to 85, tacking on three cents while most of the speculating community was more focused on the collapsing price of oil — two sides of the same coin this time, however. Which means that those wondering about how low the price of oil may go might find it time well-spent to study the dollar. The dollar made a major low near the end of 2004 near 81 (basis continuous futures). The dollar rallied from 81 to 92 by late 2005. Since then, the greenback has been in a bear market, sinking as low as 82 late in 2006. |
| Based on positive divergences at the weekly level in both the moving average convergence/divergence (MACD) histogram and the stochastic, it appears clear that the late 2006 lows were not only the lows for the 2006 bear market, but also likely represented a key higher low vis-a-vis the lower low from late 2004 (Figure 1). The most immediate result of these positive divergences is the rally that began in December 2006, the rally that has taken the March greenback up three cents in a month. |

|
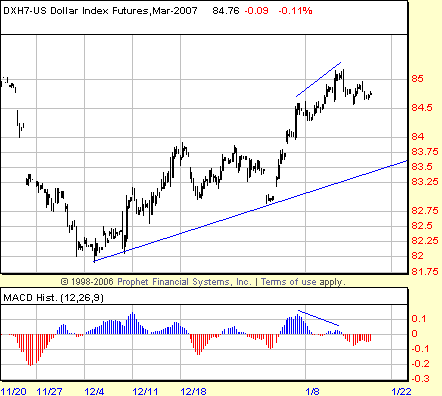
| FIGURE 2: US DOLLAR INDEX, MARCH 2007 FUTURES, 90-MINUTE. Negative divergences in both the MACD histogram and the stochastic shown in this 90-minute chart of the March greenback suggest that a pullback to recent support is likely in the near term. |
| Graphic provided by: Prophet Financial, Inc. |
| |
| A rally this sharp is begging for a correction, and the charts seem more than ready to deliver one. While breaking out above the 20-week exponential moving average (EMA), the greenback (basis continuous futures) has yet to breach the 50-week EMA. On the daily chart of the March dollar, we can clearly see potential resistance between 84.5 and 85.25 from a November consolidation range. We can also see courtesy of the Fibonacci retracements in the daily chart that the March dollar is testing the 61.8% retracement level of the October–December move lower. That 61.8% retracement level also coincides with the 85 level. |
| There are no negative divergences of note on the daily chart. But a chart that divides trading activity into 90-minute blocks does show clear negative divergences in both the MACD histogram and the stochastic (Figure 2). This suggests again that there is a slowdown in the near term for the rally in the dollar. One likely support area is also revealed on the 90-minute chart. There is a gap up between 83.75 and 84 that should provide support in the event that the moving averages, currently at 84.75 and 84.5, do not. |
Technical Writer for Technical Analysis of STOCKS & COMMODITIES magazine, Working-Money.com, and Traders.com Advantage.
| Title: | Technical Writer |
| Company: | Technical Analysis, Inc. |
| Address: | 4757 California Avenue SW |
| Seattle, WA 98116 | |
| Phone # for sales: | 206 938 0570 |
| Fax: | 206 938 1307 |
| Website: | www.Traders.com |
| E-mail address: | DPenn@traders.com |
Traders' Resource Links | |
| Charting the Stock Market: The Wyckoff Method -- Books | |
| Working-Money.com -- Online Trading Services | |
| Traders.com Advantage -- Online Trading Services | |
| Technical Analysis of Stocks & Commodities -- Publications and Newsletters | |
| Working Money, at Working-Money.com -- Publications and Newsletters | |
| Traders.com Advantage -- Publications and Newsletters | |
| Professional Traders Starter Kit -- Software | |
Click here for more information about our publications!
Comments
Date: 01/19/07Rank: 3Comment:

|

Request Information From Our Sponsors
- StockCharts.com, Inc.
- Candle Patterns
- Candlestick Charting Explained
- Intermarket Technical Analysis
- John Murphy on Chart Analysis
- John Murphy's Chart Pattern Recognition
- John Murphy's Market Message
- MurphyExplainsMarketAnalysis-Intermarket Analysis
- MurphyExplainsMarketAnalysis-Visual Analysis
- StockCharts.com
- Technical Analysis of the Financial Markets
- The Visual Investor
- VectorVest, Inc.
- Executive Premier Workshop
- One-Day Options Course
- OptionsPro
- Retirement Income Workshop
- Sure-Fire Trading Systems (VectorVest, Inc.)
- Trading as a Business Workshop
- VectorVest 7 EOD
- VectorVest 7 RealTime/IntraDay
- VectorVest AutoTester
- VectorVest Educational Services
- VectorVest OnLine
- VectorVest Options Analyzer
- VectorVest ProGraphics v6.0
- VectorVest ProTrader 7
- VectorVest RealTime Derby Tool
- VectorVest Simulator
- VectorVest Variator
- VectorVest Watchdog
