HOT TOPICS LIST
- MACD
- Fibonacci
- RSI
- Gann
- ADXR
- Stochastics
- Volume
- Triangles
- Futures
- Cycles
- Volatility
- ZIGZAG
- MESA
- Retracement
- Aroon
INDICATORS LIST
LIST OF TOPICS
PRINT THIS ARTICLE
by David Penn
Giddy talk of a bottom has shifted to anxiety about a market rallying into resistance.
Position: N/A
David Penn
Technical Writer for Technical Analysis of STOCKS & COMMODITIES magazine, Working-Money.com, and Traders.com Advantage.
PRINT THIS ARTICLE
REVERSAL
Are Housing Stocks Rolling Over?
01/18/07 08:53:25 AMby David Penn
Giddy talk of a bottom has shifted to anxiety about a market rallying into resistance.
Position: N/A
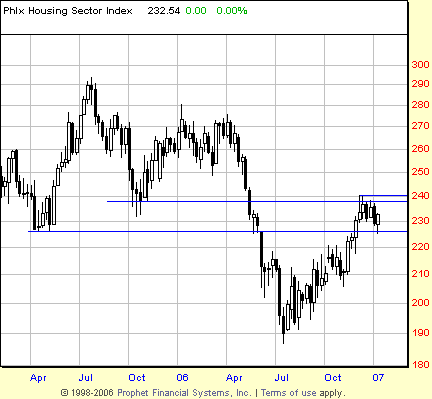
| One of the distinguishing features of the bottom in the market back in the late summer of 2006 was the number of housing stock speculators declaring the end of the bear market in the homebuilding sector. See Figure 1. |

|
| FIGURE 1: PHILADELPHIA HOUSING SECTOR INDEX, WEEKLY. After plummeting by more than 100 points from its July 2005 peak to its July 2006 bottom, $HGX sprung up for a 28% gain over the balance of 2006. Resistance between the October 2005 and April 2005 lows has so far stymied the $HGX going into 2007. |
| Graphic provided by: Prophet Financial, Inc. |
| |
| This feature was heralded by a declaration from no less than Barron's that it was now "Time to Buy Housing Stocks." Published in late August 2006, just as the bounce in the Philadelphia Homebuilding Index began moving higher in earnest, Barron's latched on to the growing bearishness in an effort to leverage a contrarian bet in favor of the group. "[With] the investment community firmly entrenched in their bearish outlook," Barron's observed, "the time to consider catching some bargain-basement prices in housing stocks may be rapidly approaching." |
| At least for a trade. Barron's timing was excellent. Those who took Barron's urging in late August to bid on housing stocks were likely rewarded in short order, as the housing index ($HGX) rallied from a low of 187 in mid-July to an intraweek high of 240 by mid-December (a 28% advance in five months). The question now, as sectors across the board seem to be setting up for a move higher in the first few months of 2007, is whether housing stocks will head still higher, or whether the move up from the second half of 2006 was merely a bounce in a bear market that has not yet run its course. |

|
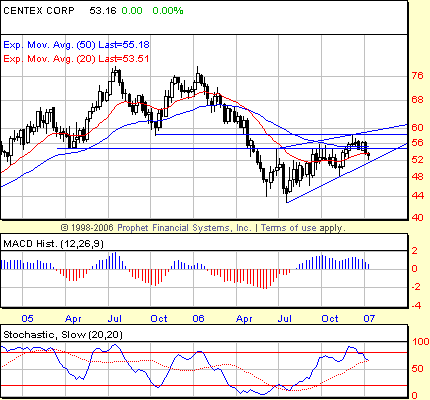
| FIGURE 2: CENTEX CORP., WEEKLY. Since rallying from a summer bottom, CTX has moved up in a wedge-shaped pattern. The negative divergence in the MACD histogram suggests that a bearish rising wedge may be the resolution of this advance, sending CTX back toward a test of the mid-2006 lows. |
| Graphic provided by: Prophet Financial, Inc. |
| |
| The downside to the advance in the housing stocks is hinted at in Figure 2 of Centex. Like housing stocks in general, CTX bottomed in the summer of 2006 and rallied over the second half of the year. And also like housing stocks in general, CTX has found resistance at levels that had functioned as support in the past: the October and April 2005 lows. The combination of CTX's rising wedge pattern and the increasing relevance of those support-turned-resistance levels should keep housing bulls from getting too far ahead of themselves — at least until that (roughly) 58 level in CTX is taken out. |
| A break of the lower of the two converging trendlines in Centex's wedge pattern would be the first true sign that the bounce that began in July 2006 had run its course and that a reversal — potentially a serious one — could be around the corner. If in fact CTX has developed a bearish rising wedge, then the downside implications could be severe. The measuring rule for bearish rising wedges suggests subtracting the formation's size from the value at the breakdown. With a formation size of approximately 14 points (58 to 44) subtracted from a likely breakdown level of about 52, a minimum downside target of 38 — below the summer of 2006 lows — is produced. |
Technical Writer for Technical Analysis of STOCKS & COMMODITIES magazine, Working-Money.com, and Traders.com Advantage.
| Title: | Technical Writer |
| Company: | Technical Analysis, Inc. |
| Address: | 4757 California Avenue SW |
| Seattle, WA 98116 | |
| Phone # for sales: | 206 938 0570 |
| Fax: | 206 938 1307 |
| Website: | www.Traders.com |
| E-mail address: | DPenn@traders.com |
Traders' Resource Links | |
| Charting the Stock Market: The Wyckoff Method -- Books | |
| Working-Money.com -- Online Trading Services | |
| Traders.com Advantage -- Online Trading Services | |
| Technical Analysis of Stocks & Commodities -- Publications and Newsletters | |
| Working Money, at Working-Money.com -- Publications and Newsletters | |
| Traders.com Advantage -- Publications and Newsletters | |
| Professional Traders Starter Kit -- Software | |
Click here for more information about our publications!
Comments
Date: 01/19/07Rank: 3Comment:

Request Information From Our Sponsors
- StockCharts.com, Inc.
- Candle Patterns
- Candlestick Charting Explained
- Intermarket Technical Analysis
- John Murphy on Chart Analysis
- John Murphy's Chart Pattern Recognition
- John Murphy's Market Message
- MurphyExplainsMarketAnalysis-Intermarket Analysis
- MurphyExplainsMarketAnalysis-Visual Analysis
- StockCharts.com
- Technical Analysis of the Financial Markets
- The Visual Investor
- VectorVest, Inc.
- Executive Premier Workshop
- One-Day Options Course
- OptionsPro
- Retirement Income Workshop
- Sure-Fire Trading Systems (VectorVest, Inc.)
- Trading as a Business Workshop
- VectorVest 7 EOD
- VectorVest 7 RealTime/IntraDay
- VectorVest AutoTester
- VectorVest Educational Services
- VectorVest OnLine
- VectorVest Options Analyzer
- VectorVest ProGraphics v6.0
- VectorVest ProTrader 7
- VectorVest RealTime Derby Tool
- VectorVest Simulator
- VectorVest Variator
- VectorVest Watchdog
