HOT TOPICS LIST
- MACD
- Fibonacci
- RSI
- Gann
- ADXR
- Stochastics
- Volume
- Triangles
- Futures
- Cycles
- Volatility
- ZIGZAG
- MESA
- Retracement
- Aroon
INDICATORS LIST
LIST OF TOPICS
PRINT THIS ARTICLE
by Arthur Hill
After trading range-bound for three months, Target broke through resistance to signal the start of a new trending phase.
Position: Accumulate
Arthur Hill
Arthur Hill is currently editor of TDTrader.com, a website specializing in trading strategies, sector/industry specific breadth stats and overall technical analysis. He passed the Society of Technical Analysts (STA London) diploma exam with distinction is a Certified Financial Technician (CFTe). Prior to TD Trader, he was the Chief Technical Analyst for Stockcharts.com and the main contributor to the ChartSchool.
PRINT THIS ARTICLE
STOCHASTICS
A New Trend For Target
01/17/07 08:32:04 AMby Arthur Hill
After trading range-bound for three months, Target broke through resistance to signal the start of a new trending phase.
Position: Accumulate
| Prices are either trending or nontrending. A trading range or consolidation represents a nontrending phase when prices move sideways. A range break often signals the end of a nontrending phase and the beginning of a trending phase. A trending phase is a sustained advance or a sustained decline. After a period of trending, prices often move into a nontrending phase in preparation for the next trending phase. It is difficult to predict the length or duration of these phases, but analysis techniques can help identify a particular phase. |

|
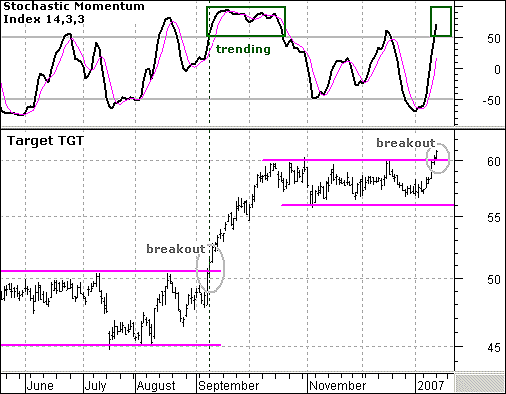
| FIGURE 1: TARGET. In early September 2006, the stochastic momentum oscillator became overbought and remained so for 29 days (green rectangle). |
| Graphic provided by: TeleChart2007. |
| Graphic provided by: Telechart 2007. |
| |
| The recent breakout in Target (TGT) spells the end of a nontrending phase and the beginning of a trending phase. Before looking at this breakout, let's look back at the early September breakout (Figure 1). TGT traded flat from mid-May to August and then broke range resistance with a strong move in early September. The move ended the nontrending phase and began a trending phase that lasted until mid-October — one and a half months. A nontrending phase then started and lasted from mid-October until early January. The recent breakout at 60 is bullish and signals the start of trending phase, and this points to a move higher. |
| Momentum oscillators, such as the stochastic momentum oscillator, can be used in both trending and nontrending phases. In a nontrending phase, momentum oscillators move from overbought to oversold levels quite often and do not remain overbought or oversold for extended periods. In a trending phase, momentum oscillators often become overbought or oversold for extended periods. In early September, the stochastic momentum oscillator became overbought and remained overbought for 29 days (green rectangle). This reflected the strong uptrend from early September to mid-October. The indicator once again turned overbought (>50) in early January, and I would expect TGT to trend higher as long as the indicator remains overbought. A move below 50 would show weakness in this trend and the breakout should then be questioned. |
Arthur Hill is currently editor of TDTrader.com, a website specializing in trading strategies, sector/industry specific breadth stats and overall technical analysis. He passed the Society of Technical Analysts (STA London) diploma exam with distinction is a Certified Financial Technician (CFTe). Prior to TD Trader, he was the Chief Technical Analyst for Stockcharts.com and the main contributor to the ChartSchool.
| Title: | Editor |
| Company: | TDTrader.com |
| Address: | Willem Geetsstraat 17 |
| Mechelen, B2800 | |
| Phone # for sales: | 3215345465 |
| Website: | www.tdtrader.com |
| E-mail address: | arthurh@tdtrader.com |
Traders' Resource Links | |
| TDTrader.com has not added any product or service information to TRADERS' RESOURCE. | |
Click here for more information about our publications!
PRINT THIS ARTICLE

|

Request Information From Our Sponsors
- StockCharts.com, Inc.
- Candle Patterns
- Candlestick Charting Explained
- Intermarket Technical Analysis
- John Murphy on Chart Analysis
- John Murphy's Chart Pattern Recognition
- John Murphy's Market Message
- MurphyExplainsMarketAnalysis-Intermarket Analysis
- MurphyExplainsMarketAnalysis-Visual Analysis
- StockCharts.com
- Technical Analysis of the Financial Markets
- The Visual Investor
- VectorVest, Inc.
- Executive Premier Workshop
- One-Day Options Course
- OptionsPro
- Retirement Income Workshop
- Sure-Fire Trading Systems (VectorVest, Inc.)
- Trading as a Business Workshop
- VectorVest 7 EOD
- VectorVest 7 RealTime/IntraDay
- VectorVest AutoTester
- VectorVest Educational Services
- VectorVest OnLine
- VectorVest Options Analyzer
- VectorVest ProGraphics v6.0
- VectorVest ProTrader 7
- VectorVest RealTime Derby Tool
- VectorVest Simulator
- VectorVest Variator
- VectorVest Watchdog
