HOT TOPICS LIST
- MACD
- Fibonacci
- RSI
- Gann
- ADXR
- Stochastics
- Volume
- Triangles
- Futures
- Cycles
- Volatility
- ZIGZAG
- MESA
- Retracement
- Aroon
INDICATORS LIST
LIST OF TOPICS
PRINT THIS ARTICLE
by Chaitali Mohile
A breakout of an ascending triangle on good volume gives good reason to be long this stock.
Position: Buy
Chaitali Mohile
Active trader in the Indian stock markets since 2003 and a full-time writer. Trading is largely based upon technical analysis.
PRINT THIS ARTICLE
ASCENDING TRIANGLES
EchoStar Breaks Out Of An Ascending Triangle
01/15/07 02:47:12 PMby Chaitali Mohile
A breakout of an ascending triangle on good volume gives good reason to be long this stock.
Position: Buy
| Drawing a trendline along a price range creates a triangle that gets narrower over time due to the lower tops and higher bottoms. Ascending triangles usually appear in uptrends and signals a continuation of the upward trend. This is a bullish formation. The pattern has a horizontal line that acts as a resistance level and an upward sloping line that is a support level. Traders typically trade between the resistance and support levels and remain very cautious during these trades. This narrows the trading range before the breakout. Once the breakout is confirmed, the volume increases. Usually, prices break out to the upside when you see an ascending triangle. The minimum target of this breakout is the width of the triangle at its widest point. A stop can be placed at the previous low for the long trades. |

|
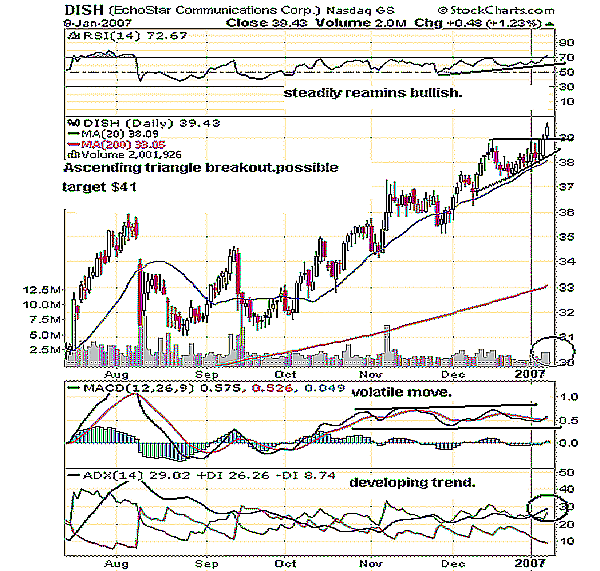
| FIGURE 1: DISH, DAILY. EchoStar gave an ascending triangle breakout at $39 on good volume. |
| Graphic provided by: StockCharts.com. |
| |
| In Figure 1, you can see that an ascending triangle breakout took place at $39 on increased volume. The stock has moved very well along the 20-day moving average. The relative strength index (RSI) (14) has moved above 70, hitting a new high, which is a positive sign of a bullish rally. The average directional movement index (ADX) (14), by moving above 20, indicates a developing trend tailwind and an end of a ranging move. The moving average convergence/divergence (MACD) is volatile throughout the move. But traders should note that this indicator cannot be followed independently. We can combine it with RSI (14) and ADX (14), which are very much bullish. As a result, traders and investors can go long this stock. |
| The breakout target is $41. This is calculated by adding $3 — the width of triangle — to $38. The stop-loss for the trade can be $35. |

|
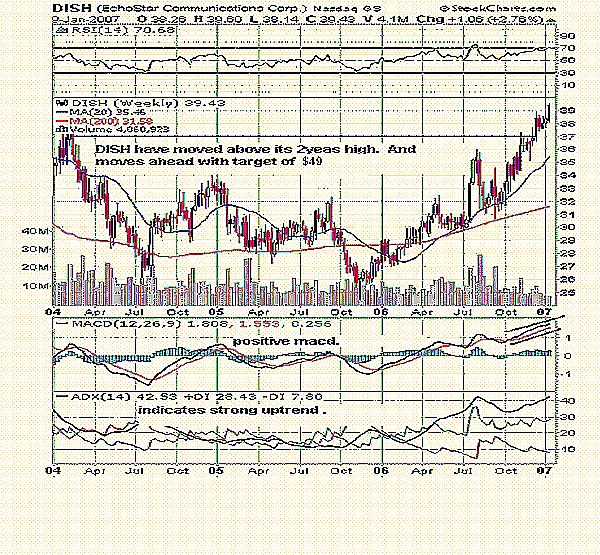
| FIGURE 2: DISH, WEEKLY. Here, this chart has also made a new lifetime high. |
| Graphic provided by: StockCharts.com. |
| |
| Figure 2 supports a long position for this stock. Here, DISH has also made an all-time high and continued till $39. A small consolidation at any level after a directional move is a good point to enter the stock. The weekly chart shows us one such entry at $39, which is the same level of the ascending triangle breakout. On this chart, MACD (12,26,9) is positive and has a sustainable uptrend. The ADX (14) is above 30, which indicates a stronger trend. The RSI can remain overbought for a longer period. The RSI even at the 70 level indicates good strength in a rally. The target is calculated based on the previous rally from the lowest point of $25 to $37. Thus, if $12 is added to $37, we get the target of $49. |
| Hence, I would recommend traders and investors to buy this DISH breakout. |
Active trader in the Indian stock markets since 2003 and a full-time writer. Trading is largely based upon technical analysis.
| Company: | Independent |
| Address: | C1/3 Parth Indraprasth Towers. Vastrapur |
| Ahmedabad, Guj 380015 | |
| E-mail address: | chaitalimohile@yahoo.co.in |
Traders' Resource Links | |
| Independent has not added any product or service information to TRADERS' RESOURCE. | |
Click here for more information about our publications!
Comments
Date: 01/16/07Rank: 4Comment:

Request Information From Our Sponsors
- StockCharts.com, Inc.
- Candle Patterns
- Candlestick Charting Explained
- Intermarket Technical Analysis
- John Murphy on Chart Analysis
- John Murphy's Chart Pattern Recognition
- John Murphy's Market Message
- MurphyExplainsMarketAnalysis-Intermarket Analysis
- MurphyExplainsMarketAnalysis-Visual Analysis
- StockCharts.com
- Technical Analysis of the Financial Markets
- The Visual Investor
- VectorVest, Inc.
- Executive Premier Workshop
- One-Day Options Course
- OptionsPro
- Retirement Income Workshop
- Sure-Fire Trading Systems (VectorVest, Inc.)
- Trading as a Business Workshop
- VectorVest 7 EOD
- VectorVest 7 RealTime/IntraDay
- VectorVest AutoTester
- VectorVest Educational Services
- VectorVest OnLine
- VectorVest Options Analyzer
- VectorVest ProGraphics v6.0
- VectorVest ProTrader 7
- VectorVest RealTime Derby Tool
- VectorVest Simulator
- VectorVest Variator
- VectorVest Watchdog
