HOT TOPICS LIST
- MACD
- Fibonacci
- RSI
- Gann
- ADXR
- Stochastics
- Volume
- Triangles
- Futures
- Cycles
- Volatility
- ZIGZAG
- MESA
- Retracement
- Aroon
INDICATORS LIST
LIST OF TOPICS
PRINT THIS ARTICLE
by Koos van der Merwe
So you believe that the hedge against a falling US dollar is to buy gold shares. Well, so does everyone else. Here is a stock to put on your watchlist.
Position: Accumulate
Koos van der Merwe
Has been a technical analyst since 1969, and has worked as a futures and options trader with First Financial Futures in Johannesburg, South Africa.
PRINT THIS ARTICLE
FLAGS AND PENNANTS
Gabriel Resources
01/11/07 01:44:28 PMby Koos van der Merwe
So you believe that the hedge against a falling US dollar is to buy gold shares. Well, so does everyone else. Here is a stock to put on your watchlist.
Position: Accumulate
| Gabriel Resources Ltd. is a Canadian-based resource company currently engaged in the exploration and development of mineral properties in Romania, with its primary focus on the development of its joint Rosia Montana gold/silver project. Through a joint venture with the Romanian government, Gabriel Resources holds an 80% interest in the Rosia Montana project, which contains reserves of 10.1 million ounces of gold and 47.6 million ounces of silver. |

|
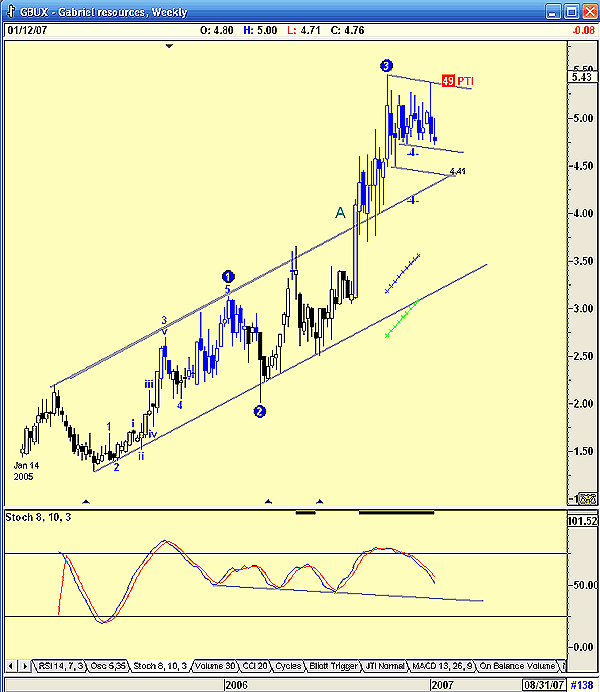
| FIGURE 1: GABRIEL RESOURCES, WEEKLY. The mine first started trading in early 2005 before reaching a high in October that year. |
| Graphic provided by: AdvancedGET. |
| |
| Figure 1 is a weekly chart, showing that the mine first started trading on January 14, 2005, at $1.44. It reached a high of $5.45 on October 20, 2005, and has since been consolidating in what appears to be a flag formation. Weekly volatility in the past few weeks appears to be high, as shown by the candlestick where the bodies on most weeks were a lot shorter than the price movement for that week. An Elliott wave count as suggested by the Advanced GET program shows that a fourth wave has still to be completed (a 49% probability of this happening). The program also suggests an immediate target of $4.61 with an outside target of $4.11. The stochastic indicator is negative but is approaching a level, shown by the trendline, where the price has turned positive. Note how at point A the price broke above the main resistance line, which appears to have become a support line. |

|
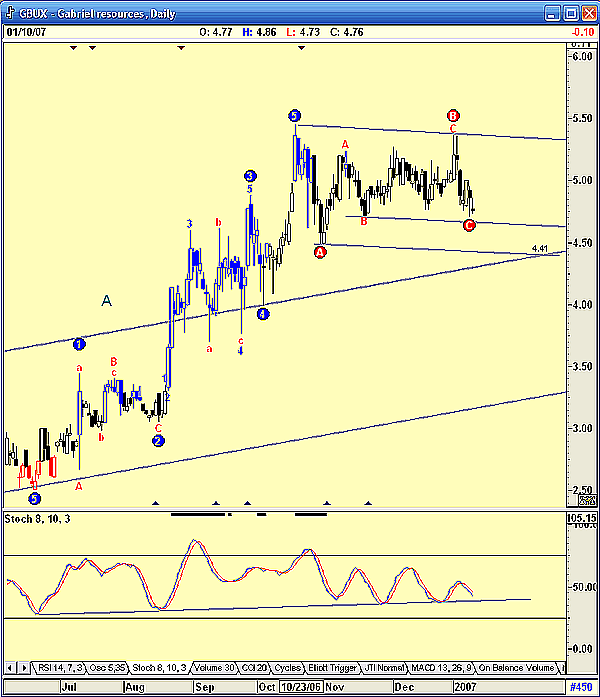
| FIGURE 2: GABRIEL RESOURCES, DAILY. The flag formation is shown here, where the short-term support line meets the long-term resistance trendline. |
| Graphic provided by: AdvancedGET. |
| |
| Figure 2 shows the flag formation more clearly, suggesting a target of $4.41, the confluence where the short-term support line of the flag meets the long-term resistance/now support trendline before a movement up. The stochastic indicator does appear to be bumping along a support trendline and suggests that a turning point could occur in the near future. To obtain a more definite analysis, I turn to an Omnitrader daily chart. |

|
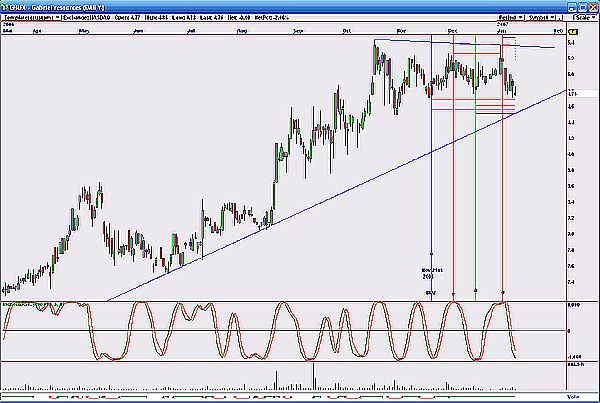
| FIGURE 3: GABRIEL RESOURCES, DAILY.<,/B> Here are the Omnitrader buy and sell signals. |
| Graphic provided by: OMNITRADER PROFESSIONAL. |
| |
| Figure 3 shows that the buy signal was given on the vote line on November 21 when the price was $4.72, and retained that position even though the stochastic relative strength index (RSI) shown on the chart did give short-term buy and sell signals (shown with vertical lines). At the moment the indicator is falling and could soon reach an oversold position, giving a short-term buy. Should you decide that you would like to buy the stock, wait for this signal. |
| To conclude, Gabriel Resources looks very interesting and could be bought once the indicator suggests. Or the vote line of the Omnitrader program gives a reinforcing buy. |
Has been a technical analyst since 1969, and has worked as a futures and options trader with First Financial Futures in Johannesburg, South Africa.
| Address: | 3256 West 24th Ave |
| Vancouver, BC | |
| Phone # for sales: | 6042634214 |
| E-mail address: | petroosp@gmail.com |
Click here for more information about our publications!
Comments
Date: 01/11/07Rank: 2Comment:

Request Information From Our Sponsors
- StockCharts.com, Inc.
- Candle Patterns
- Candlestick Charting Explained
- Intermarket Technical Analysis
- John Murphy on Chart Analysis
- John Murphy's Chart Pattern Recognition
- John Murphy's Market Message
- MurphyExplainsMarketAnalysis-Intermarket Analysis
- MurphyExplainsMarketAnalysis-Visual Analysis
- StockCharts.com
- Technical Analysis of the Financial Markets
- The Visual Investor
- VectorVest, Inc.
- Executive Premier Workshop
- One-Day Options Course
- OptionsPro
- Retirement Income Workshop
- Sure-Fire Trading Systems (VectorVest, Inc.)
- Trading as a Business Workshop
- VectorVest 7 EOD
- VectorVest 7 RealTime/IntraDay
- VectorVest AutoTester
- VectorVest Educational Services
- VectorVest OnLine
- VectorVest Options Analyzer
- VectorVest ProGraphics v6.0
- VectorVest ProTrader 7
- VectorVest RealTime Derby Tool
- VectorVest Simulator
- VectorVest Variator
- VectorVest Watchdog
