HOT TOPICS LIST
- MACD
- Fibonacci
- RSI
- Gann
- ADXR
- Stochastics
- Volume
- Triangles
- Futures
- Cycles
- Volatility
- ZIGZAG
- MESA
- Retracement
- Aroon
INDICATORS LIST
LIST OF TOPICS
PRINT THIS ARTICLE
by Gary Grosschadl
Despite nearby support, this stock may slip lower.
Position: Sell
Gary Grosschadl
Independent Canadian equities trader and technical analyst based in Peterborough
Ontario, Canada.
PRINT THIS ARTICLE
RESISTANCE LINE
3M Looking Tired
01/11/07 09:59:40 AMby Gary Grosschadl
Despite nearby support, this stock may slip lower.
Position: Sell
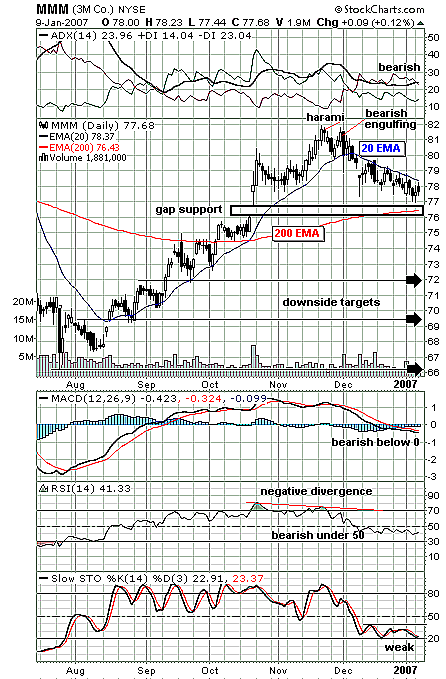
| The daily chart for 3M shows a trend change by virtue of a common moving average line -- the 20-day exponential moving average (EMA). Here we see a great example of how well this moving average can track support and resistance. Starting from the initial break above the 20-day EMA back in August, the stock climbed to its peak of $82 with close support from this moving average line. Once the stock topped out, it weakened to below the 20-day EMA, signaling a coming downleg. Note the candlestick warning patterns of first the harami (small-bodied candlestick contained within a previous candle body) and then a bearish engulfing pattern. |
| Now the principle of "previous support becomes resistance" comes into play. This 20-day EMA now acts as overhead resistance. Until the stock rises and holds above the 20-day EMA, the bears are in control. What makes this interesting is the nearby confluence of possible support from the previous gap and the 200-day EMA. The look of the chart and the displayed indicators has me leaning toward further downside. However, the axiom of "the market is always right" makes me cautious. The market will soon tell us whether this nearby support will hold beyond a short pause. See Figure 1. |

|
| FIGURE 1: 3M, DAILY. Will gap support and the 200-day EMA save this decline? |
| Graphic provided by: StockCharts.com. |
| |
| Several indicators help color my perception of what lies ahead. At the top of the chart the DMI (directional movement indicator) shows a bearish mode with its negative directional indicator (-DI) atop its positive counterpart (+DI). Below the chart, another trend strength indicator, the moving average convergence/divergence (MACD), shows a bearish slope and decline below its zero line. This line would have to reverse course to coincide with any bullish move north. The relative strength index (RSI) reflects current weakness below its key 50 level. Meanwhile, the stochastic oscillator shows particular unwillingness to sustain an upleg of its own. |
| Should this bearish tone be correct, then three downside targets should be near $72, $69, and $66. These relate to previous support levels on the chart. The market will soon cast its deciding vote with either a lasting bounce off the 200-day EMA support or further decline. The proof (as always) is in the pudding, or put another way -- the market is always right, so keep your options open either way. |
Independent Canadian equities trader and technical analyst based in Peterborough
Ontario, Canada.
| Website: | www.whatsonsale.ca/financial.html |
| E-mail address: | gwg7@sympatico.ca |
Click here for more information about our publications!
Comments
Date: 01/11/07Rank: 5Comment:
Date: 01/11/07Rank: 5Comment:

Request Information From Our Sponsors
- StockCharts.com, Inc.
- Candle Patterns
- Candlestick Charting Explained
- Intermarket Technical Analysis
- John Murphy on Chart Analysis
- John Murphy's Chart Pattern Recognition
- John Murphy's Market Message
- MurphyExplainsMarketAnalysis-Intermarket Analysis
- MurphyExplainsMarketAnalysis-Visual Analysis
- StockCharts.com
- Technical Analysis of the Financial Markets
- The Visual Investor
- VectorVest, Inc.
- Executive Premier Workshop
- One-Day Options Course
- OptionsPro
- Retirement Income Workshop
- Sure-Fire Trading Systems (VectorVest, Inc.)
- Trading as a Business Workshop
- VectorVest 7 EOD
- VectorVest 7 RealTime/IntraDay
- VectorVest AutoTester
- VectorVest Educational Services
- VectorVest OnLine
- VectorVest Options Analyzer
- VectorVest ProGraphics v6.0
- VectorVest ProTrader 7
- VectorVest RealTime Derby Tool
- VectorVest Simulator
- VectorVest Variator
- VectorVest Watchdog
