

HOT TOPICS LIST
- MACD
- Fibonacci
- RSI
- Gann
- ADXR
- Stochastics
- Volume
- Triangles
- Futures
- Cycles
- Volatility
- ZIGZAG
- MESA
- Retracement
- Aroon
INDICATORS LIST
LIST OF TOPICS
PRINT THIS ARTICLE
by Arthur Hill
Amgen surged on big volume but stalled at resistance, and bullish consolidation formed on the intraday chart. The next few days are critical.
Position: Hold
Arthur Hill
Arthur Hill is currently editor of TDTrader.com, a website specializing in trading strategies, sector/industry specific breadth stats and overall technical analysis. He passed the Society of Technical Analysts (STA London) diploma exam with distinction is a Certified Financial Technician (CFTe). Prior to TD Trader, he was the Chief Technical Analyst for Stockcharts.com and the main contributor to the ChartSchool.
PRINT THIS ARTICLE
RESISTANCE LINE
Amgen Surges To Resistance
01/10/07 08:26:51 AMby Arthur Hill
Amgen surged on big volume but stalled at resistance, and bullish consolidation formed on the intraday chart. The next few days are critical.
Position: Hold
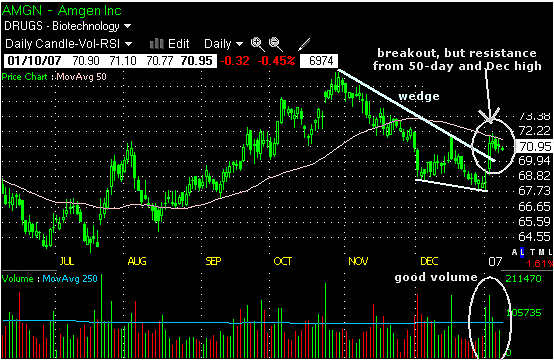
| Amgen (AMGN) was quite weak in November and December. The stock led the market from mid-July to late October but then fell apart at the beginning of November. The November–December decline formed a falling wedge and the stock broke trendline resistance with a big surge in early January. This is a great start, but a little follow-through is required to reverse the downtrend and call for higher prices. See Figure 1. |
|
| FIGURE 1: AMGN, DAILY. The November–December decline formed a falling wedge and the stock broke trendline resistance with a big surge in early January. |
| Graphic provided by: Telechart 2007. |
| |
| An uptrend is made up of higher highs and higher lows. AMGN surged from a lower low and has yet to forge a higher high. Technically, the stock did exceed the mid-December high, but in reality, the stock is consolidating near this high. It is not a clean break. Resistance in this area is confirmed by the 50-day moving average. A clean break of the 50-day and mid-December high is required to consider a medium-term trend change and expect a challenge to the October high. |
|
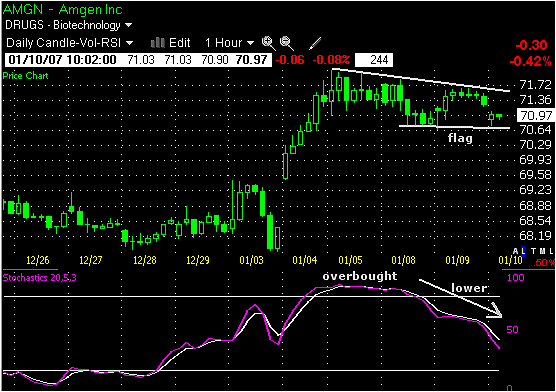
| FIGURE 2: AMGN, HOURLY. The stock became short-term overbought and a falling flag/wedge is taking shape. |
| Graphic provided by: Telechart 2007. |
| |
| Zeroing in on the short-term picture with the 60-minute chart (Figure 2), we can see that the stock became short-term overbought and a falling flag/wedge is taking shape. The stochastic oscillator surged above 80 on January 4 and held above 80 for two days. Momentum then declined as the stock traded flat and the stochastic oscillator has been moving lower the last few days. Look for a break back above the signal line (white) and above 50 to signal an upturn in momentum. On the price chart, the decline over the last few days is slight, but it has yet to be reversed. A move above 71.72 would break the flag high and call for a continuation of the early January surge. |
Arthur Hill is currently editor of TDTrader.com, a website specializing in trading strategies, sector/industry specific breadth stats and overall technical analysis. He passed the Society of Technical Analysts (STA London) diploma exam with distinction is a Certified Financial Technician (CFTe). Prior to TD Trader, he was the Chief Technical Analyst for Stockcharts.com and the main contributor to the ChartSchool.
| Title: | Editor |
| Company: | TDTrader.com |
| Address: | Willem Geetsstraat 17 |
| Mechelen, B2800 | |
| Phone # for sales: | 3215345465 |
| Website: | www.tdtrader.com |
| E-mail address: | arthurh@tdtrader.com |
Traders' Resource Links | |
| TDTrader.com has not added any product or service information to TRADERS' RESOURCE. | |
Click here for more information about our publications!
Comments
Date:�01/11/07Rank:�4Comment:�

Request Information From Our Sponsors
- StockCharts.com, Inc.
- Candle Patterns
- Candlestick Charting Explained
- Intermarket Technical Analysis
- John Murphy on Chart Analysis
- John Murphy's Chart Pattern Recognition
- John Murphy's Market Message
- MurphyExplainsMarketAnalysis-Intermarket Analysis
- MurphyExplainsMarketAnalysis-Visual Analysis
- StockCharts.com
- Technical Analysis of the Financial Markets
- The Visual Investor
- VectorVest, Inc.
- Executive Premier Workshop
- One-Day Options Course
- OptionsPro
- Retirement Income Workshop
- Sure-Fire Trading Systems (VectorVest, Inc.)
- Trading as a Business Workshop
- VectorVest 7 EOD
- VectorVest 7 RealTime/IntraDay
- VectorVest AutoTester
- VectorVest Educational Services
- VectorVest OnLine
- VectorVest Options Analyzer
- VectorVest ProGraphics v6.0
- VectorVest ProTrader 7
- VectorVest RealTime Derby Tool
- VectorVest Simulator
- VectorVest Variator
- VectorVest Watchdog