HOT TOPICS LIST
- MACD
- Fibonacci
- RSI
- Gann
- ADXR
- Stochastics
- Volume
- Triangles
- Futures
- Cycles
- Volatility
- ZIGZAG
- MESA
- Retracement
- Aroon
INDICATORS LIST
LIST OF TOPICS
PRINT THIS ARTICLE
by Arthur Hill
The Amex Broker–Dealer Index broke triangle resistance and is leading the market. The breakout is clearly bullish, but will it hold?
Position: Hold
Arthur Hill
Arthur Hill is currently editor of TDTrader.com, a website specializing in trading strategies, sector/industry specific breadth stats and overall technical analysis. He passed the Society of Technical Analysts (STA London) diploma exam with distinction is a Certified Financial Technician (CFTe). Prior to TD Trader, he was the Chief Technical Analyst for Stockcharts.com and the main contributor to the ChartSchool.
PRINT THIS ARTICLE
TRIANGLES
A Broker–Dealer Breakout
01/10/07 08:13:58 AMby Arthur Hill
The Amex Broker–Dealer Index broke triangle resistance and is leading the market. The breakout is clearly bullish, but will it hold?
Position: Hold
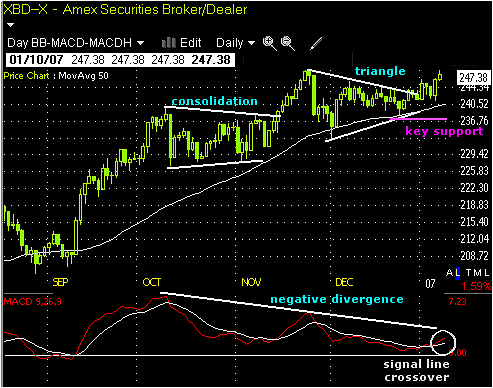
| On the price chart (Figure 1), the AMEX Broker–Dealer Index ($XBD) led the market higher with surges in September and again in November. In between, there was a consolidation period from October 11 to November 10. The index again consolidated from late November to late December and again broke consolidation resistance. This breakout signals a continuation of the current uptrend and targets a move to new highs. Brokers are the backbone of Wall Street, and a breakout in this group bodes well for the overall market. |

|
| FIGURE 1: AMEX BROKER-DEALER INDEX, DAILY. The XBD led the market higher with surges in September and again in November. |
| Graphic provided by: TC2000.com. |
| Graphic provided by: Telechart 2007. |
| |
| A breakout is only good as long as it holds. Until there is proof to the contrary, we should treat this breakout as bullish and expect higher prices. What would it take to prove otherwise? The index established support at 238 in late December and a break below this level would totally negate the breakout. The 50-day moving average, the lower triangle trendline, and the late December low all confirm support in this area. A move below 238 would break all three and spell trouble. In addition, the surge over the last two weeks should hold, and failure to hold these gains would be most negative. |
| Waning momentum is a concern, but the moving average convergence/divergence (MACD) still favors the bulls right now. While the index moved to a new high in late November, the MACD formed a lower high and this shows that upside momentum was not as strong. The index is once again on the verge of a new high and the MACD remains below its November high. Again, momentum ain't what it used to be. Even so, the MACD is holding in positive territory and the MACD moved above its signal line the first week of January. Negative divergences are a concern, but these cannot be considered bearish unless the MACD moves back below its signal line. To negate this breakout and turn bearish, look for a move below the signal line in the MACD and a move below 238 in XBD. |
Arthur Hill is currently editor of TDTrader.com, a website specializing in trading strategies, sector/industry specific breadth stats and overall technical analysis. He passed the Society of Technical Analysts (STA London) diploma exam with distinction is a Certified Financial Technician (CFTe). Prior to TD Trader, he was the Chief Technical Analyst for Stockcharts.com and the main contributor to the ChartSchool.
| Title: | Editor |
| Company: | TDTrader.com |
| Address: | Willem Geetsstraat 17 |
| Mechelen, B2800 | |
| Phone # for sales: | 3215345465 |
| Website: | www.tdtrader.com |
| E-mail address: | arthurh@tdtrader.com |
Traders' Resource Links | |
| TDTrader.com has not added any product or service information to TRADERS' RESOURCE. | |
Click here for more information about our publications!
Comments
Date: 01/11/07Rank: 4Comment:

Request Information From Our Sponsors
- StockCharts.com, Inc.
- Candle Patterns
- Candlestick Charting Explained
- Intermarket Technical Analysis
- John Murphy on Chart Analysis
- John Murphy's Chart Pattern Recognition
- John Murphy's Market Message
- MurphyExplainsMarketAnalysis-Intermarket Analysis
- MurphyExplainsMarketAnalysis-Visual Analysis
- StockCharts.com
- Technical Analysis of the Financial Markets
- The Visual Investor
- VectorVest, Inc.
- Executive Premier Workshop
- One-Day Options Course
- OptionsPro
- Retirement Income Workshop
- Sure-Fire Trading Systems (VectorVest, Inc.)
- Trading as a Business Workshop
- VectorVest 7 EOD
- VectorVest 7 RealTime/IntraDay
- VectorVest AutoTester
- VectorVest Educational Services
- VectorVest OnLine
- VectorVest Options Analyzer
- VectorVest ProGraphics v6.0
- VectorVest ProTrader 7
- VectorVest RealTime Derby Tool
- VectorVest Simulator
- VectorVest Variator
- VectorVest Watchdog
