HOT TOPICS LIST
- MACD
- Fibonacci
- RSI
- Gann
- ADXR
- Stochastics
- Volume
- Triangles
- Futures
- Cycles
- Volatility
- ZIGZAG
- MESA
- Retracement
- Aroon
INDICATORS LIST
LIST OF TOPICS
PRINT THIS ARTICLE
by David Penn
Does the current test of support mean that biotech stocks are finally ready to move?
Position: N/A
David Penn
Technical Writer for Technical Analysis of STOCKS & COMMODITIES magazine, Working-Money.com, and Traders.com Advantage.
PRINT THIS ARTICLE
SECTOR INVESTING
The Biotech Bet Is Back
01/09/07 02:26:20 PMby David Penn
Does the current test of support mean that biotech stocks are finally ready to move?
Position: N/A
| Back in mid-June 2006, I wrote an article for Working-Money.com discussing the upside potential for biotechnology stocks ("Betting On Biotech," June 13, 2006). What drew my attention to biotech was a suggestion in Yale and Jeffrey Hirsch's Stock Trader's Almanac that the seasonality for biotech was especially favorable between July and March. |

|
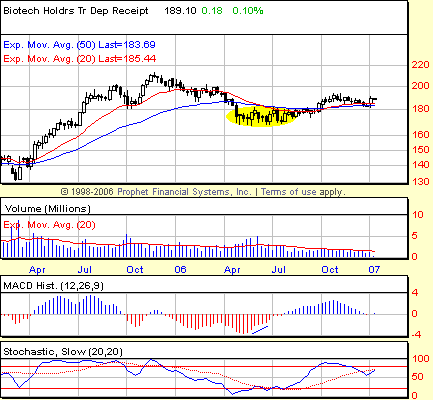
| FIGURE 1: BIOTECH HOLDRS, WEEKLY. A consolidation range from late spring to mid-summer 2006 so far has acted as an accumulation zone as BBH moved cautiously higher over the balance of the year. The reversal in the MACD histogram in this weekly chart was one hint that the resolution of the summer consolidation was likely to be a bullish one. |
| Graphic provided by: Prophet Financial, Inc. |
| |
| Mid-June might have been an excellent time to be reminding traders and investors of biotechnology stocks. After all, the correction in these stocks — as measured by BBH — that began in November 2005 ended the week of June 19. But speculators in these stocks are, in some instances, still waiting for the payoff. Although the BBH has risen from the 170 level in the summer of 2006 to test the 190 level as recently as last week, a number of biotech stocks did not move higher appreciably in the second half of 2006. |
| There are signs that another move higher for biotechnology stocks may be in the making and with that move, potentially, some much-needed wind in the sails of many individual biotech issues. These signs come in the form of a weekly moving average convergence/divergence (MACD) histogram that, as of this writing, has bottomed and reversed back to the upside (Figure 1). That this histogram did so without recording a strongly negative MACD histogram reading during the pullback in late December and earliest January is an additional bullish sign. That the pullback itself appears to have found support at the 20- and 50-week exponential moving averages (EMAs) is all the more noteworthy. |

|
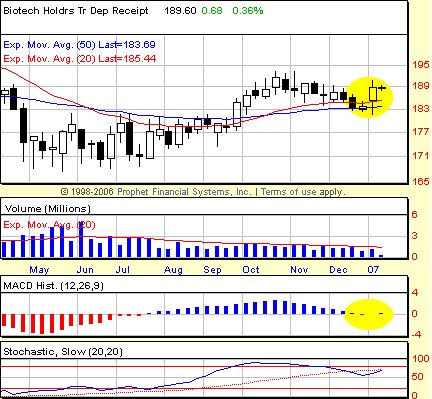
| FIGURE 2: BIOTECH HOLDRS, WEEKLY. A shallow dip into negative territory and a bounce back into the positive for the weekly MACD histogram suggests strongly the possibility of further gains if BBH is able to close above the high of the week of the histogram's reversal to the upside. |
| Graphic provided by: Prophet Financial, Inc. |
| |
| Not only has there been a pullback in BBH, it also appears as if the advance that haltingly began back in June 2006 may be about to resume in the wake of that pullback. Figure 2 shows where the pullback appears to have found support at the 20- and 50- week EMAs. It also shows how the MACD histogram developed a bullish "P-p-P" pattern from the week of December 18 through the week beginning January 1 (for more on histogram patterns, see my Working-Money.com article, "Trading The MACD Histogram, Part I" and "Trading The MACD Histogram, Part II" from December 6 and December 29, respectively). Note how on the final "P" of that "P-p-P" pattern volume and range, both increase as BBH bounces off of moving average support. |
| For a full-fledged buy signal to develop using this weekly chart, the BBH will have to make a weekly close above the high of the week beginning January 1. While this may mean an entry price that is "uncomfortably" higher than a speculator might prefer, there are three things worth remembering. The first thing is that being able to buy a bounce off of support — such as that provided by the two moving averages mentioned — is not an opportunity to be casually ignored. The second thing is that weekly buy signals from the MACD histogram often have significant staying power, and whatever points are lost by not buying closer to the week of January 1 high at 190.70 could easily be made up by a BBH that takes out the October 2006 high at 193 or tests the March 2006 high near 199. The third and last thing is that focusing on opportunities unveiled by the weekly chart does not preclude shorter-term traders from looking to trade around BBH. |
Technical Writer for Technical Analysis of STOCKS & COMMODITIES magazine, Working-Money.com, and Traders.com Advantage.
| Title: | Technical Writer |
| Company: | Technical Analysis, Inc. |
| Address: | 4757 California Avenue SW |
| Seattle, WA 98116 | |
| Phone # for sales: | 206 938 0570 |
| Fax: | 206 938 1307 |
| Website: | www.Traders.com |
| E-mail address: | DPenn@traders.com |
Traders' Resource Links | |
| Charting the Stock Market: The Wyckoff Method -- Books | |
| Working-Money.com -- Online Trading Services | |
| Traders.com Advantage -- Online Trading Services | |
| Technical Analysis of Stocks & Commodities -- Publications and Newsletters | |
| Working Money, at Working-Money.com -- Publications and Newsletters | |
| Traders.com Advantage -- Publications and Newsletters | |
| Professional Traders Starter Kit -- Software | |
Click here for more information about our publications!
Comments
Date: 01/09/07Rank: 3Comment:

Request Information From Our Sponsors
- StockCharts.com, Inc.
- Candle Patterns
- Candlestick Charting Explained
- Intermarket Technical Analysis
- John Murphy on Chart Analysis
- John Murphy's Chart Pattern Recognition
- John Murphy's Market Message
- MurphyExplainsMarketAnalysis-Intermarket Analysis
- MurphyExplainsMarketAnalysis-Visual Analysis
- StockCharts.com
- Technical Analysis of the Financial Markets
- The Visual Investor
- VectorVest, Inc.
- Executive Premier Workshop
- One-Day Options Course
- OptionsPro
- Retirement Income Workshop
- Sure-Fire Trading Systems (VectorVest, Inc.)
- Trading as a Business Workshop
- VectorVest 7 EOD
- VectorVest 7 RealTime/IntraDay
- VectorVest AutoTester
- VectorVest Educational Services
- VectorVest OnLine
- VectorVest Options Analyzer
- VectorVest ProGraphics v6.0
- VectorVest ProTrader 7
- VectorVest RealTime Derby Tool
- VectorVest Simulator
- VectorVest Variator
- VectorVest Watchdog
