HOT TOPICS LIST
- MACD
- Fibonacci
- RSI
- Gann
- ADXR
- Stochastics
- Volume
- Triangles
- Futures
- Cycles
- Volatility
- ZIGZAG
- MESA
- Retracement
- Aroon
INDICATORS LIST
LIST OF TOPICS
PRINT THIS ARTICLE
by David Penn
The retail stock HOLDRS wedged higher, but negative divergences frustrated progress.
Position: N/A
David Penn
Technical Writer for Technical Analysis of STOCKS & COMMODITIES magazine, Working-Money.com, and Traders.com Advantage.
PRINT THIS ARTICLE
CONSOLID FORMATION
Can Retail Be Trusted To Break Out?
01/09/07 08:34:28 AMby David Penn
The retail stock HOLDRS wedged higher, but negative divergences frustrated progress.
Position: N/A
| Retail stocks began the second leg of their bull market advance from the spring 2003 bottom during the summer of 2004. As measured by the retail stock HOLDRS (RTH), retail stocks advanced some 50% from the spring of 2003 to early 2004 in the first leg of their bull market and then rallied more than 37% from the low in the summer of 2004 to their high in the autumn of 2005. |

|
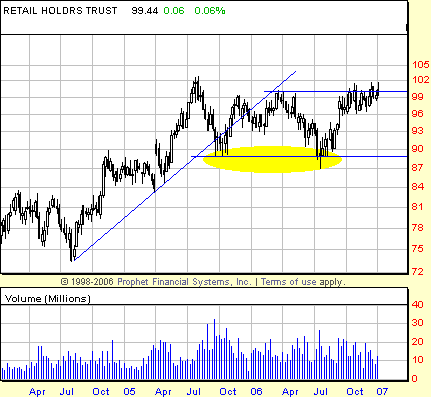
| FIGURE 1: RETAIL HOLDRS TRUST, WEEKLY. Retail stocks settled into a wide-ranging consolidation zone shortly after topping out in the late summer of 2005. The highlighted area shows a 2B test of bottom that resulted in a powerful rally in retail stocks during the second half of 2006. |
| Graphic provided by: Prophet Financial, Inc. |
| |
| Since making an intraweek high just shy of 103 in August 2005, RTH has slipped into a relatively wide-ranging consolidation pattern (Figure 1). During the back-and-forth trading that has characterized the RTH over the past year, the HOLDRS have slipped to as low as 88 and rallied to as high as 102. What the RTH has failed to do — a failure that was especially notable in the final months of 2006 — was to close above the 100 level on a weekly basis, hold that close, and then follow through with a higher weekly close. |
| RTH provided traders and investors with a fairly clear-cut buying opportunity back in the late summer of 2006. At the time, RTH was testing lows established back in September 2005. On a weekly basis, RTH closed below those September 2005 lows briefly in the summer of 2006 but did not show any significant follow-through to the downside. This was a clue, a 2B bottom type of clue, that the correction in retail stocks (a relatively minor one, which began in the spring of 2006) had likely run its course. Within 10 weeks, the RTH was back trading near the top of its 14-point range. |

|
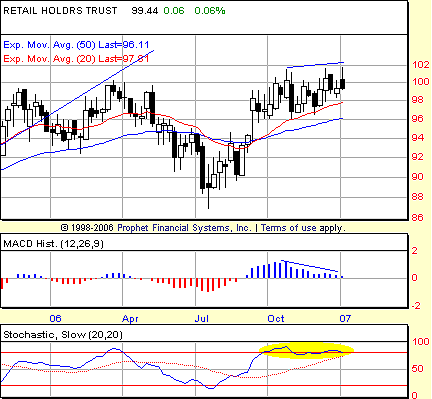
| FIGURE 2: RETAIL HOLDRS TRUST, WEEKLY. Although not as decisive as some negative divergences, the negative divergences in the MACD histogram and the stochastic should provide enough of a cautionary tale for would-be retail stock traders and investors. |
| Graphic provided by: Prophet Financial, Inc. |
| |
| Will this most recent trip to the top of the range — the third since the RTH topped out in the summer of 2005 — be the charm? The stakes, it would appear, are great insofar as a 14-point range implies a 14-point move — to the upside or the downside — once the consolidation has been breached successfully. Currently, it appears as if the RTH will struggle to move higher. This is due to the short-term negative divergences in the MACD histogram and stochastic that have been building since October (Figure 2). These are not the most decisive negative divergences to ever appear on a price chart — and I would not be surprised if all they end up heralding is the continuation of slightly lower to sideways price action until the overbought nature of both indicators wears off somewhat and investors become disinterested in retail stocks altogether. |
| In fact, if the indicators can unwind without the RTH suffering in the way of price depreciation, then the stage could be set for powerfully higher moves in retail stocks once current resistance between 100 and 102 is surpassed on a weekly closing basis. |
Technical Writer for Technical Analysis of STOCKS & COMMODITIES magazine, Working-Money.com, and Traders.com Advantage.
| Title: | Technical Writer |
| Company: | Technical Analysis, Inc. |
| Address: | 4757 California Avenue SW |
| Seattle, WA 98116 | |
| Phone # for sales: | 206 938 0570 |
| Fax: | 206 938 1307 |
| Website: | www.Traders.com |
| E-mail address: | DPenn@traders.com |
Traders' Resource Links | |
| Charting the Stock Market: The Wyckoff Method -- Books | |
| Working-Money.com -- Online Trading Services | |
| Traders.com Advantage -- Online Trading Services | |
| Technical Analysis of Stocks & Commodities -- Publications and Newsletters | |
| Working Money, at Working-Money.com -- Publications and Newsletters | |
| Traders.com Advantage -- Publications and Newsletters | |
| Professional Traders Starter Kit -- Software | |
Click here for more information about our publications!
Comments
Date: 01/09/07Rank: 3Comment:

Request Information From Our Sponsors
- StockCharts.com, Inc.
- Candle Patterns
- Candlestick Charting Explained
- Intermarket Technical Analysis
- John Murphy on Chart Analysis
- John Murphy's Chart Pattern Recognition
- John Murphy's Market Message
- MurphyExplainsMarketAnalysis-Intermarket Analysis
- MurphyExplainsMarketAnalysis-Visual Analysis
- StockCharts.com
- Technical Analysis of the Financial Markets
- The Visual Investor
- VectorVest, Inc.
- Executive Premier Workshop
- One-Day Options Course
- OptionsPro
- Retirement Income Workshop
- Sure-Fire Trading Systems (VectorVest, Inc.)
- Trading as a Business Workshop
- VectorVest 7 EOD
- VectorVest 7 RealTime/IntraDay
- VectorVest AutoTester
- VectorVest Educational Services
- VectorVest OnLine
- VectorVest Options Analyzer
- VectorVest ProGraphics v6.0
- VectorVest ProTrader 7
- VectorVest RealTime Derby Tool
- VectorVest Simulator
- VectorVest Variator
- VectorVest Watchdog
